By Lawrence G. McMillan
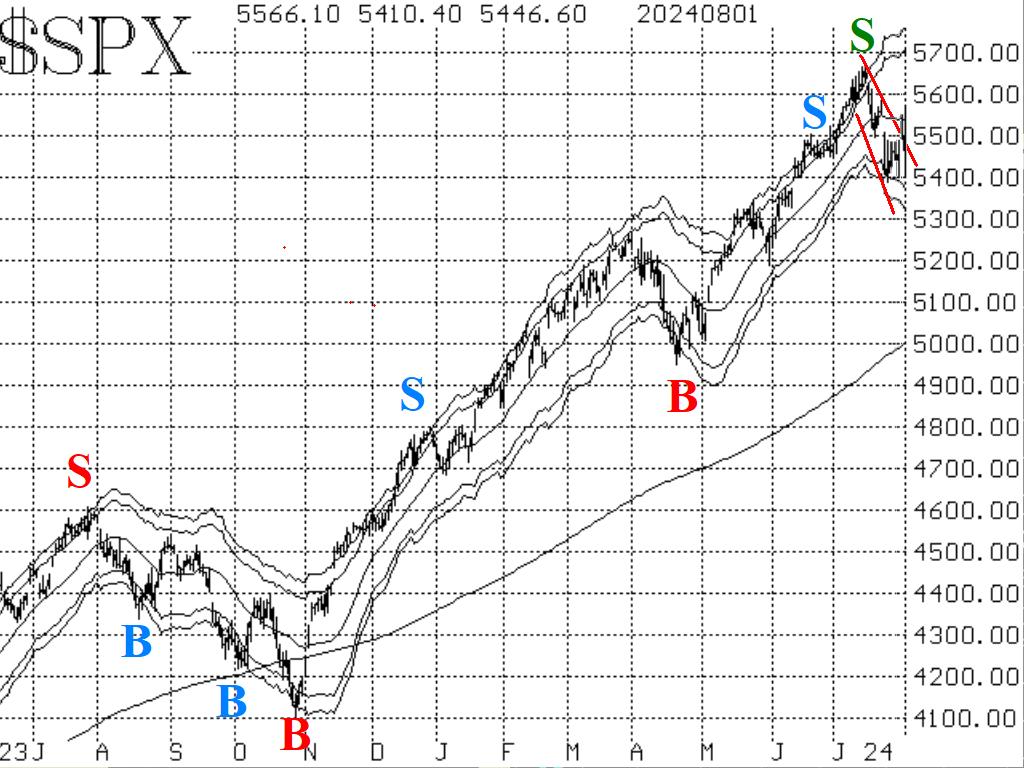
The pattern of lower highs and lower lows on the $SPX chart continues to signal that this is now a bearish environment. A very manipulative month-end rally (using the FOMC meeting as a smoke screen) carried $SPX well over 100 points higher in a blink so that month end performance fees could be charged (why isn't that ever investigated?). Once that was out of the way, though, reality set in and $SPX is down 300 points in a little more than 24 hours worth of trading. This latest plunge has now broken support at 5400 -- a level at which had held intraday declines several times in the last week and a half. Furthermore, the gap down to 5370 has been filled. A close below 5370 will add another bearish element to the $SPX chart. The next support level could be as low as 5200 the late May lows.
Equity-only put-call ratios remain on sell signals. They did alter their upward (bearish for stocks) course this week, even when $SPX rallied. These will remain bearish until they roll over and begin to trend downward.
Breadth has been fairly strong, which indicates that small caps are doing much better than big-caps in the current environment. Even so, if breadth is negative again on Monday, these breadth oscillators will be on confirmed sell signals.
Implied volatility is signaling a bearish state for the stock market, although there have been some mixed signals.
First of all, there was a "spike peak" buy signal at the close of trading on July 31st, when $VIX closed exactly 3.00 points lower than its previous peak of July 25th. Today, that signal is blown to bits as $VIX has exploded through the old peak and is now trading at a near-panic level of 28. Saving the day, to a certain extent, was the fact that there was also a trend of $VIX sell signal on July 31st. See the box on the right-hand side of Figure 4. That is where the 20-day Moving Average of $VIX crossed above the 200-day MA. Since $VIX itself was already above that MA, it was a sell signal. That sell signal will remain in effect until $VIX closes below its 20-day Moving Average for two consecutive days.
The market has gone from a bullish juggernaut in mid-July to a complete shambles of itself in just a couple of weeks. We are seeing more sell signals emerge, and we will trade them as they are confirmed.
This Market Commentary is an abbreviated version of the commentary featured in The Option Strategist Newsletter.
© 2023 The Option Strategist | McMillan Analysis Corporation

