By Lawrence G. McMillan
The stock market's rally since bottoming out on August 5th has been historic. The speed with which the correction and the recovery have taken place is astounding. This type of price action has been evident elsewhere, too, sometimes with even greater velocity ($VIX, for example).
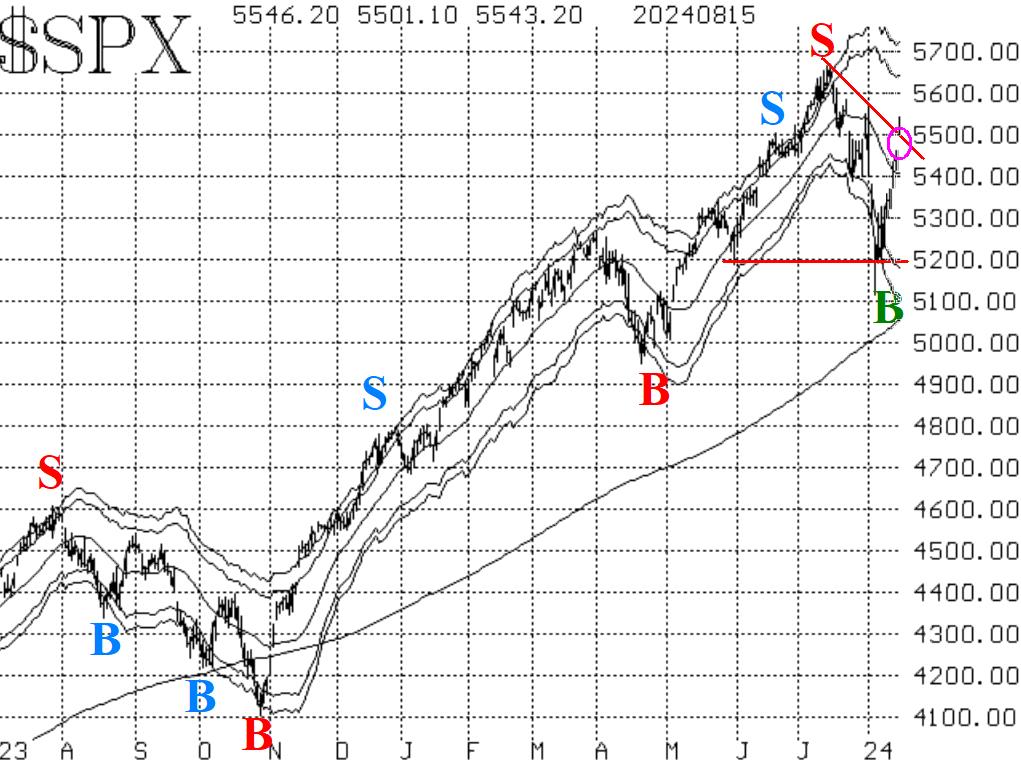
Typically, oversold rallies will rally back to the declining 20- day Moving Average (or perhaps a little higher) and then run out of steam. But, if the rally is so strong that it breaks the bearish pattern of lower highs and lower lows, then that rally can be considered the next leg of a bull market -- an upgrade over a mere "oversold" rally. This rally is on the verge of accomplishing that upgrade. The chart in Figure 1 shows the downtrend line connecting the two most recent peaks. $SPX has broken above the downtrend line with an upside gap move (circle on chart). So, the only remaining impediment to upgrading this rally to a fully bullish status is for it to overcome the August 1st peak at 5567. That would break the pattern of lower highs and should lead to new all-time highs for $SPX. If that does not happen, the door remains open for the bears to resume control, although they seem to have no firepower at all at the moment.
The equity-only put call ratios (Figure 2 and 3) have remained on sell signals even during this strong rally that has taken place since August 5th. The weighted ratio (Figure 3) has slowed its ascent, but the computer analysis programs continue to say that this is going higher and that it remains on a sell signal. The bearishness of these ratios would end if they were to roll over and begin to decline.
Market breadth has rebounded from oversold conditions, and both breadth oscillators are currently on buy signals. In addition, with the strong breadth of August 15th, both of these oscillators are in overbought territory. This is a good sign when a new rebound rally is taking place, but breadth needs to keep up this pace, lest the oscillators roll over to sell signals.
Implied volatility, as measured by $VIX, remains in a somewhat mixed state, although that may not be the case for much longer. First, the "spike peak" buy signal that took place on August 5th remains in place. Nearly simultaneously, though, a trend of $VIX sell signal took place (red box on the chart in Figure 4), when the 20-day Moving Average of $VIX crossed above the 200-day MA. This sell signal would be stopped out if $VIX closes back below its 200-day Moving Average.
We have traded nearly all of the confirmed signals that have taken place, and we have current positions from those signals on both sides of the market. We will continue to trade all confirmed signals, and we will continue to roll positions to take partial profits when the options become deeply in-the-money.
This Market Commentary is an abbreviated version of the commentary featured in The Option Strategist Newsletter.
© 2023 The Option Strategist | McMillan Analysis Corporation

