By Lawrence G. McMillan
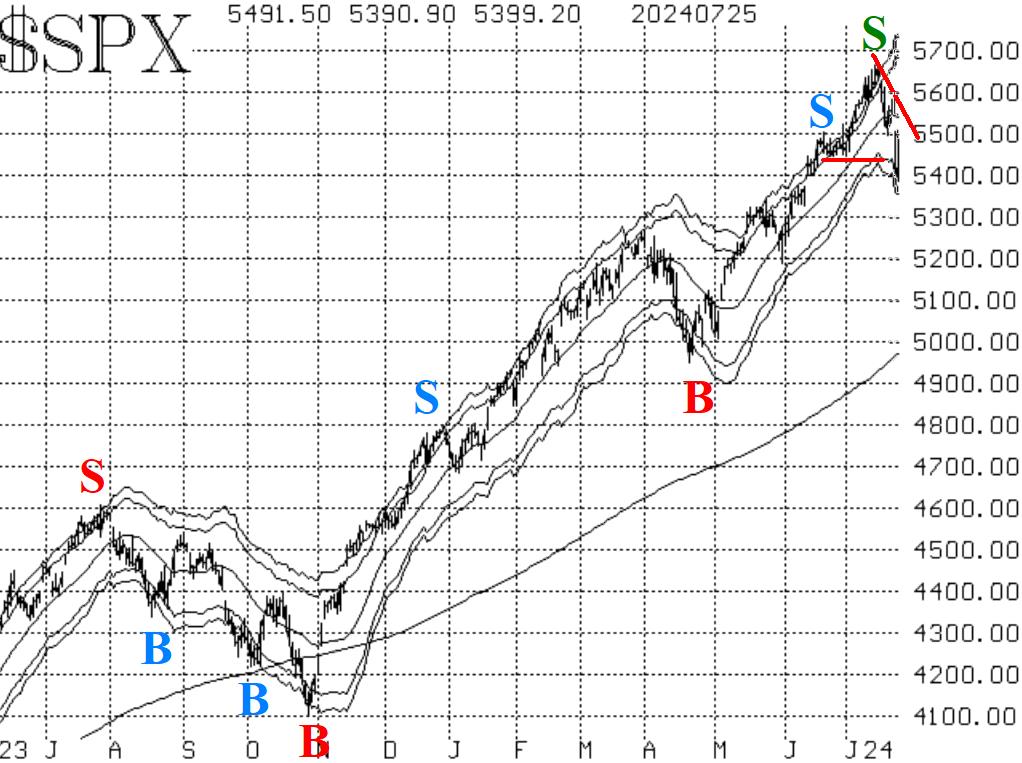
After making new all-time highs in the first half of July, $SPX pulled back to support near 5500. That was a normal pullback, and it bounced off of there. However, what has happened since has been far more bearish than a "normal" pullback. That bounce carried up to 5585 but failed, and now $SPX has not only fallen back below 5500, but it has violated the support at 5440. That creates a bearish pattern of a lower high and a lower low. Hence, the $SPX chart is no longer bullish, and a "core" bullish position is no longer justifiable. If $SPX were to climb back above 5585, that would reverse the current bearishness of the chart, but that may not be easy to accomplish.
There are some potential support areas below current prices: a gap would be closed at 5370, and then there is a support area at 5200-5270. A close below 5200 would be very bearish, for it would mean that the market is right back where it was in early 2022, more than two years ago.
Equity-only put-call ratios are both on sell signals. The weighted ratio turned sharply upward a week ago, and that was a sell signal at the time. Now, the standard ratio has joined in, although it still is not leaping higher. In any case, these will remain bearish for stocks as long as they continue to rise.
Breadth was been all over the place. In the first half of July, breadth statistics improved sharply because small-cap stocks were finally attracting some buying. That picture has become more mixed as $SPX has faltered this week. Finally, as of July 25th, both breadth oscillators have confirmed sell signals (a 2-day confirmation was required). Even so, the market is higher on July 26th, with strong positive breadth, so those sell signals might be called into question quickly. The rotation into small caps still seems to be taking place.
$VIX has finally risen sharply. First of all, it crossed above its 200-day Moving Average, and that stopped out the trend of $VIX buy signal. Note: this is not a sell signal, it is merely a return to a neutral status for this indicator. In addition, $VIX has gone into "spiking" mode. That will eventually lead to a "spike peak" buy signal for stocks.
In summary, we are no longer holding a "core" bullish position. As usual, we will continue to trade confirmed signals as they occur.
This Market Commentary is an abbreviated version of the commentary featured in The Option Strategist Newsletter.
© 2023 The Option Strategist | McMillan Analysis Corporation

