By Lawrence G. McMillan
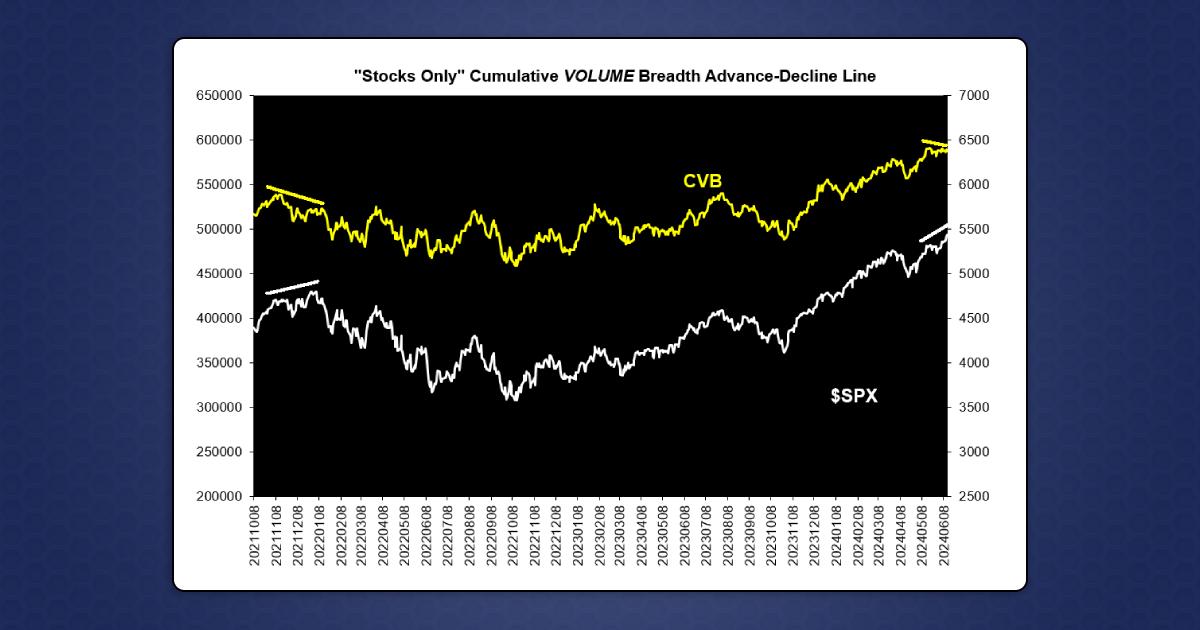
When there is a divergence between the cumulative breadth indicators and the stock market itself ($SPX), it sometimes warns of a major market top. We follow cumulative volume breadth (CVB), but the same sort of thing can be seen with simple cumulative breadth indicators, too. CVB last made a new all time high on May 20th, along with $SPX. Since then $SPX has gone on to make higher closing highs five times, including each of the last four days. CVB has not made a new all time high yet (although it is not far from doing so). So, that is a minor short term divergence. In my opinion, that’s too short of a time to be a true warning sign, but we shall see.
The above graph of CVB shows the last couple of years. On the left is the divergence that developed for a couple of months in late 2021 and early 2022. One can see that the yellow line (CVB) was trending lower, while the white line (SPX) was still trending higher. That was a true warning sign, as it preceded the bear market of 2022...
Read the full article by subscribing to The Option Strategist Newsletter now. Existing subscribers can access the article here.
© 2023 The Option Strategist | McMillan Analysis Corporation

