By Lawrence G. McMillan
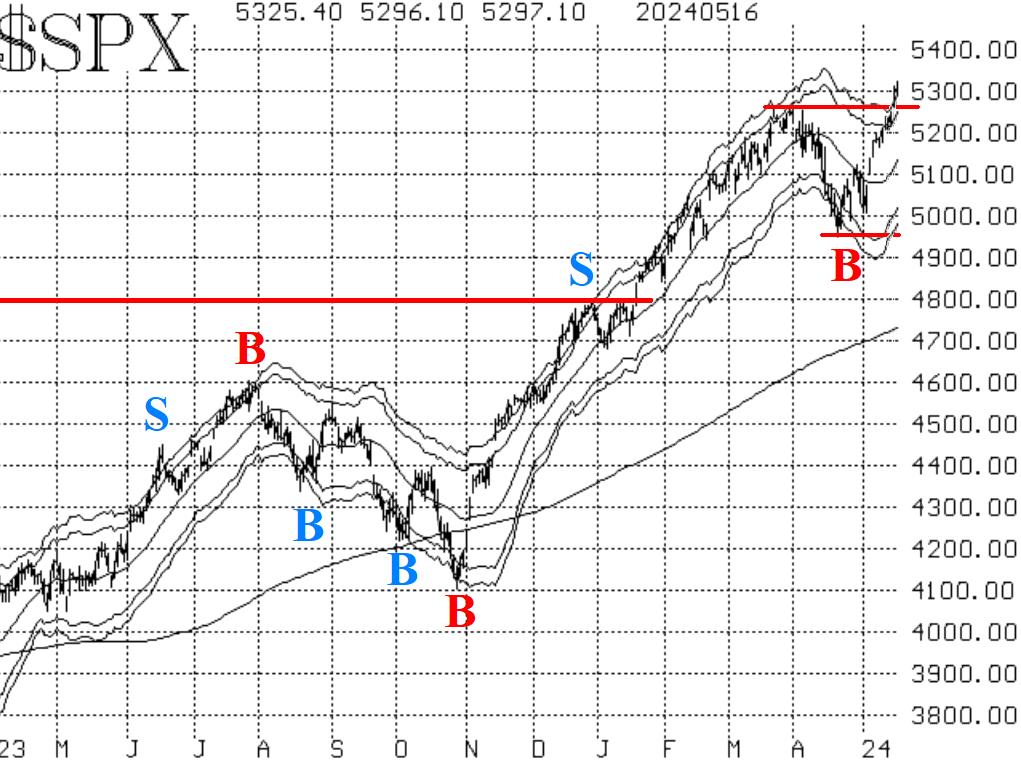
The last of our indicators to turn fully bullish was the chart of $SPX itself. Sometimes that happens, where $SPX is lagging the indicators, but now it has caught up. The move to new all-time highs by the Index was confirmed with a two-day close. Now, there should be support at or just below the breakout level in the 5230-5260 area, say.
Equity-only put-call ratios are finally both on confirmed buy signals for stocks. They will remain on these buy signals as long as they are declining.
Breadth has remained quite positive, with a few modestly negative breadth days sprinkled in from time to time. The breadth oscillators thus remain on buy signals, and they are in overbought territory. That is okay when $SPX is moving on a new leg upward, as it is now. These breadth oscillators could withstand two or three days of negative breadth and still remain on buy signals.
$VIX is back near its lows of the last year. That is benign for now. It's only a problem for stocks when $VIX begins to rise. As long as it stays low, stocks can rally. The "spike peak" buy signal that was issued on April 22nd is still in place.
Meanwhile, there has been a new trend of $VIX buy signal (for stocks). That's because the 20-day Moving Average of $VIX has crossed below the 200-day MA (see circle on the chart in Figure 4), and $VIX was already below the 200-day MA.
In summary, all of our indicators are bullish or neutral at this time. We are rolling profitable positions up when the become deeply in-the-money and are taking some positions off if they have reached their targets. Meanwhile, we are now in a "core" bullish position but will trade other confirmed signals around that.
This Market Commentary is an abbreviated version of the commentary featured in The Option Strategist Newsletter.
© 2023 The Option Strategist | McMillan Analysis Corporation

