By Lawrence G. McMillan
There was finally a correction of sorts this week, as some late afternoon selling on December 20th ballooned into a 70-point decline in a matter of less than two hours. Considering that the market had been more or less straight up for days even weeks and it was thus quite overbought, it was not a total surprise to see something of that nature.
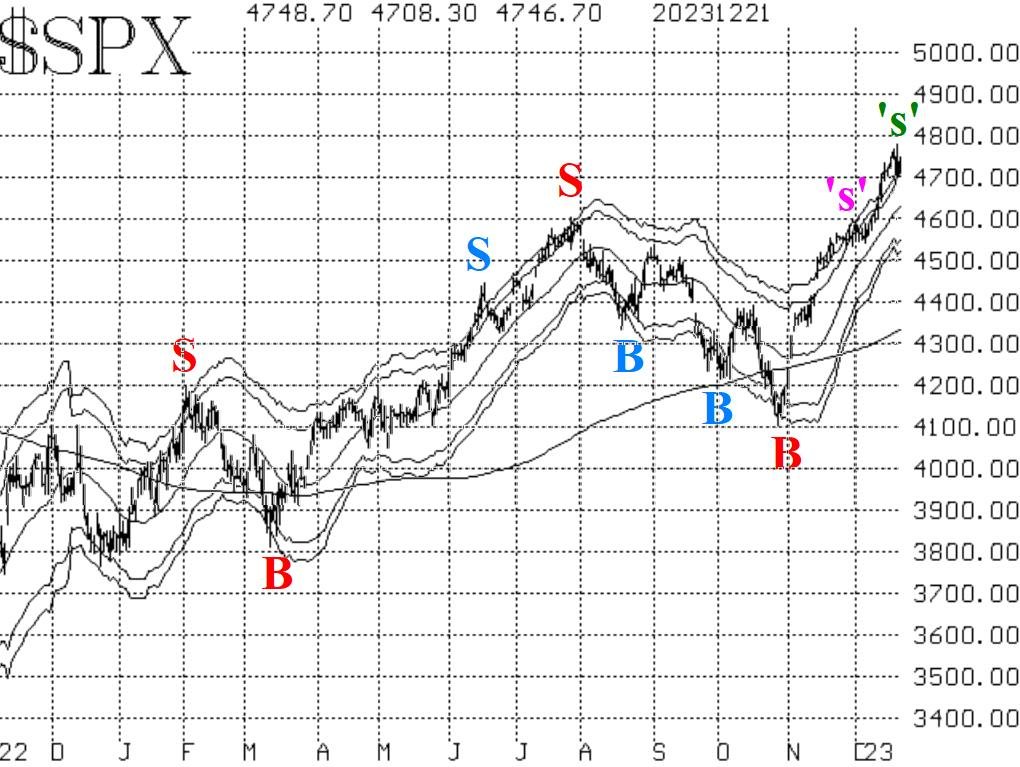
$SPX remains in a solid uptrend, and its chart is still bullish. There is still a target of the 2022 highs at 4800 (the all-time highs). A move above that level seems to be almost inevitable at this point.
The decline extended to about 4700, so that is a short-term support area. Below that, support is much lower because the speed of the rally didn't leave much time for backing and filling. The next support area is in the 4540-4570 area, where $SPX traded in late November and early December.
The weighted equity-only put-call ratio (Figure 3) has edged higher, and this is enough for the computer analysis programs to call this a sell signal. Thus, it is marked with a green "S" on the chart. If the weighted ratio drops to a new relative low, that would cancel out the sell signal. The standard ratio (Figure 2), however, just made another new relative low, so it remains on a buy signal at this time.
Breadth has been all over the place. But both breadth oscillators remain on buy signals. The one big down day this week, even though it was a 90% down day, was not enough to throw the oscillators over to sell signals. At this point, it's still going to take at least a couple of days of negative breadth in order to generate sell signals from our breadth oscillators.
$VIX had a very muted reaction to the sharp stock market decline on December 20th. So, the trend of $VIX buy signal remains in place. Overall, $VIX is currently still in the bullish camp in its outlook for stocks.
Also, we are now entering the third of the three bullish seasonal periods that follow Thanksgiving. This is the Santa Claus Rally, and it encompasses the last five trading days of one year and the first two trading days of the next year. Typically, the market rallies a little more than 1% over that time frame. However, if the market should instead decline over that period, it would be a negative sign for stocks in the new year. That time period began with the close of trading on Thursday, December 21st, and is in effect right now.
In summary, we are maintaining a "core" bullish position, in line with the bullishness of the $SPX chart. We are rolling calls up as they become deeply in-the-money, or taking partial profits. We will continue to trade new signals around this "core" position.
This Market Commentary is an abbreviated version of the commentary featured in The Option Strategist Newsletter.

© 2023 The Option Strategist | McMillan Analysis Corporation