By Lawrence G. McMillan
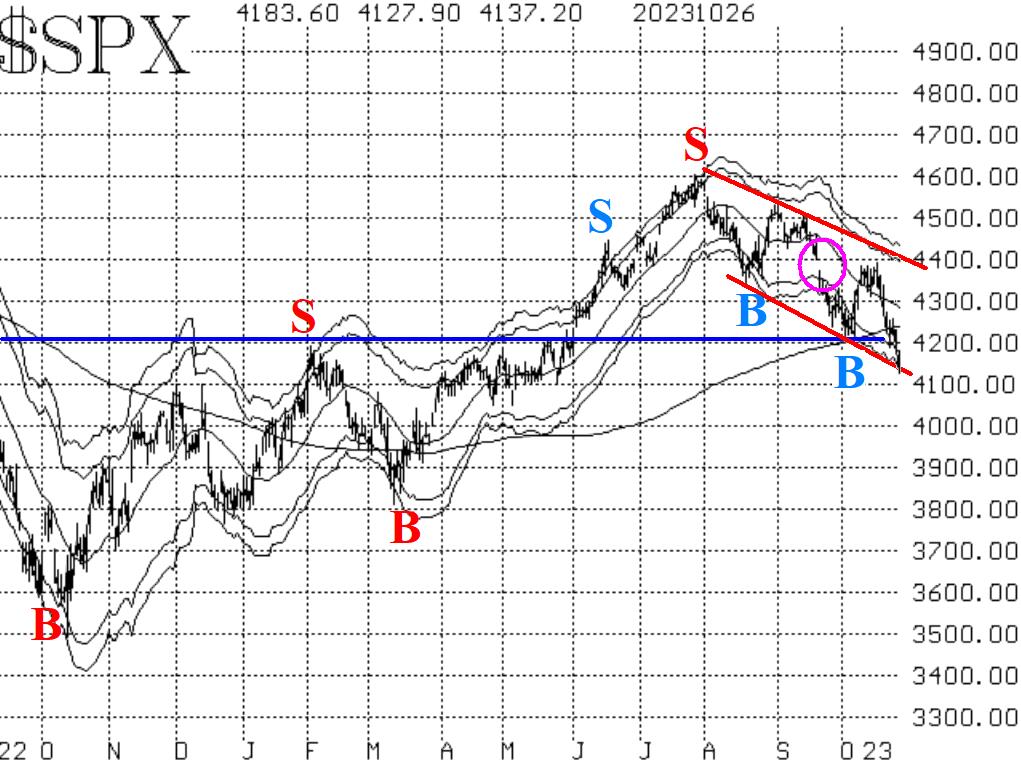
The dominating feature of the $SPX chart is the downtrend. Lower highs and lower lows: that's all you really need to be aware of. Don't overthink it. New lows were made again this week. So, we are still carrying a "core" bearish position.
Yes, oversold conditions are beginning to arise again, but they didn't produce much of a rally at the beginning of October when $SPX bounced off the 4200 level and off of the then-rising 200-day Moving Average. That was a typical "oversold" rally meaning that the market only rallied because sellers were out of the way for a short time.
Eventually, there will be a stronger reason for a rally, based on buy signals from internal indicators, but they haven't taken place yet.
Equity-only put-call ratios remain split: the standard ratio (Figure 2) remains on a buy signal, which quite clearly has been wrong. The weighted ratio (Figure 3), however, continues to make new relative highs and thus remains on a sell signal.
Breadth has generally been poor, with only one day of positive breadth this week. Thus the breadth oscillators remain on sell signals, although they are deeply oversold. Oversold does not mean buy, of course, and it's going to take at least a couple of days of positive breadth to generate buy signals here.
Even the volatility complex is taking on a more bearish (or should I say, less bullish?) tone. True, there was a $VIX "spike peak" buy signal last Friday, but there is also an intermediate-term trend of $VIX sell signal. The trend of $VIX sell signal could be in place for a lengthy period of time.
The indicators above are still fairly negative, but there is one positive which is going to begin at today's close, and that is the October seasonal buy signal. The track record for this trade is strong -- even in bearish markets -- and it can even produce a sharp rally in the midst of chaos. But it only lasts for four days.
In summary, we are maintaining a "core" bearish position as long as the $SPX chart is in a downtrend. We will trade other signals around that "core."
This Market Commentary is an abbreviated version of the commentary featured in The Option Strategist Newsletter.

© 2023 The Option Strategist | McMillan Analysis Corporation