By Lawrence G. McMillan
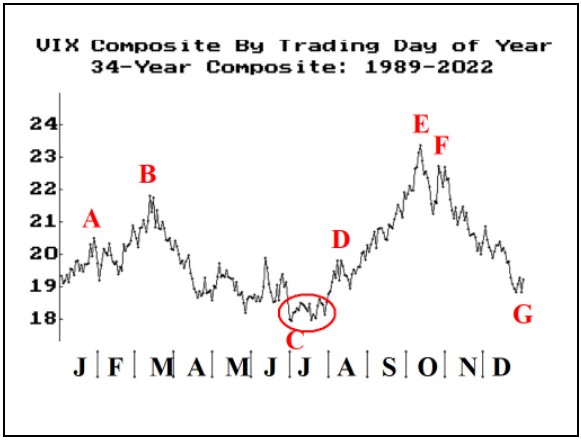
Here’s a chart that we haven’t revisited in a while. It shows the composite value of $VIX (actually, $VXO in the early years) from 1989 through 2022. In reality, the CBOE backdated the original $VIX data to 1986, but including 1987 in the chart just distorts things too much. As it is, the inclusion of the March 2020 $VIX explosion has changed the chart a little.
Typically $VIX starts the year at a low point and rises through most of January, to point “A” on the accompanying chart. Then there is a lull until another $VIX rally in March (Point “B”). Prior to 2022, that March rally was subdued, but of course it was monstrous in 2020, so point “B” is higher than it used to be.
From there, $VIX declines into its summer lows. For years, the composite low of $VIX was right on the 4th of July holiday. Now, it’s spread throughout the month of July. So, point “C” is really that entire circle surrounding the low area of the annual chart...
Read the full article, published on 5/12/2023, by subscribing to The Option Strategist Newsletter now. Existing subscribers can access the article here.

© 2023 The Option Strategist | McMillan Analysis Corporation