
By Lawrence G. McMillan
Over the last week, new 52-week Lows have been dominating New 52-week Highs, across all three data sets: NYSE, NASDAQ, and “stocks only.” The day after $SPX rallied to its all-time high close at 4712, there were over900 new 52-week lows in optionable stocks, and over 600 in NASDAQ. So, with $SPX just off its highs, there were hundreds of stocks making new 52-week lows. That is a stark picture of just how much negative divergence there is in this market. Put-call ratios and market breadth also can attest to this.
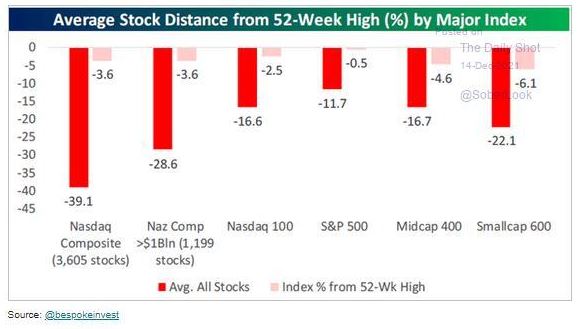
The graph above shows five major indices, and the contrast between how the index has done (pink bars) and how the “average stock” has done (red bars). This is evidence of the negative divergence that has taken place. In each case, these are cap-weighted indices, meaning that the largest stocks dominate the index price. That narrow group of stocks is what people are buying, while the rest suffer. In fact, I would suspect that many retail investors are selling their losing stocks and buying even more AAPL and MSFT. This has happened many times in the past, the most famous of which was probably the “Nifty 50" of 1972–1973. Eventually, the ensuing bear market takes them all out, as was the case in 1973–1974...
To read this entire commentary, subscribe to The Option Strategist Newsletter.

© 2023 The Option Strategist | McMillan Analysis Corporation