
By Lawrence G. McMillan
A couple of years ago, we put together some facts and came up with an “early warning" sell signal, based on historical volatility of $SPX.
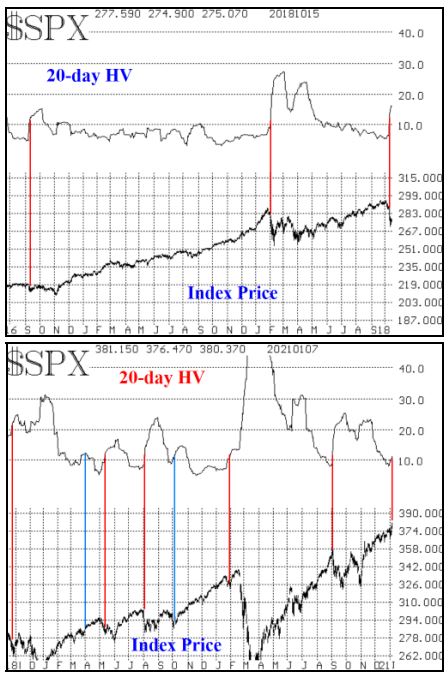
The sell signals for the last four years are shown in the charts below. On each chart, the 20-day Historical Volatility (HV) of $SPX is on the top and the price of $SPX is on the bottom. Red or blue vertical lines show where the signals occurred. Red lines are successful signals; blue are unsuccessful. Most of the major declines during this time period were warned of by this realized volatility sell signal...
Read the full article, published on 1/8/2021, by subscribing to The Option Strategist Newsletter now. Existing subscribers can access the article here.

© 2023 The Option Strategist | McMillan Analysis Corporation