
By Lawrence G. McMillan
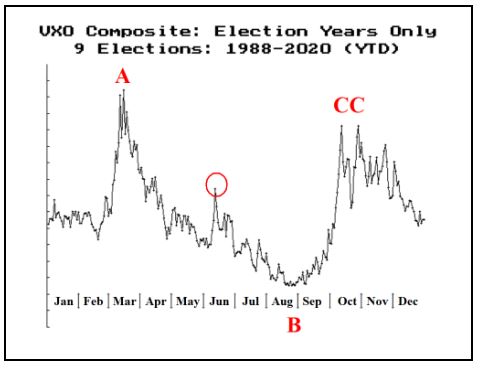
We have previously seen that $VIX has a slightly different pattern in election years than in most years. We wrote about this in the September 4th issue, so please refer to that article for more detail on this. The graph of $VIX in election years is reprinted below. The wild market action of 2020 caused point “A” to be much higher than it previously was (maybe we should be using the median here, too). The low point of $VIX after that occurs just about exactly on the first of September, and 2020 matches up with that pretty well. From there, $VIX rises sharply into October, holding onto its high levels until the election takes place and then begins to back off. It remains to be seen if that scenario will play out this year.
My personal feeling is that the “big rise” in October is much easier to attain when $VIX starts from a low base (say, 15 or below) and much more difficult in years like this. This is a phenomenon that we discussed in the last issue (the fact that $VIX is somewhat unresponsive on the upside in the first correction after a bear market).
This article was originially published in the 10/9/2020 edition of The Option Strategist Newsletter. Existing subscribers can access the article here.

© 2023 The Option Strategist | McMillan Analysis Corporation