
By Lawrence G. McMillan
The mBB indicator is probably at its best when trying to identify when to sell something that is in a parabolic rise (or when to buy something that is in freefall). Typical moving averages are too slow to catch the movements, but the mBB seem to do a good job with $SPX. In the past, we’ve often looked at using the mBB strategy on something other than $SPX, but it never seems to work all that well, although our sample size is small. I recall that we attempted to use it on Apple (AAPL) as a buy signal last year.
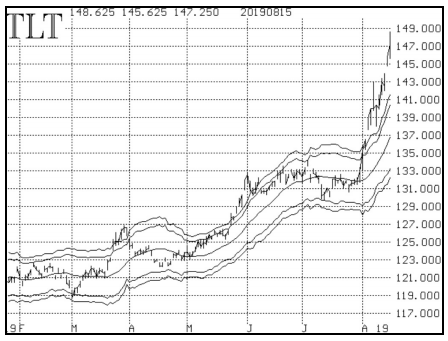
But one place that it has worked before is on the long Bond ETF(symbol: TLT). The chart above shows the current state of TLT: it is well above the +4σ Band, exploding to the upside. A sell signal would be given when it closes below the +3σ Band, which is at 140.75 and rising rapidly, but still well below the current price of TLT (147.25).
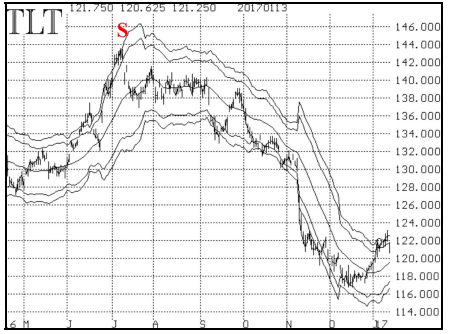
Back in 2016 was the last time that TLT was in a strong uptrend and exceeded its +4σ Band – and not by nearly the amount it’s exceeding it now. In any case, after the sell signal in early July 2016 (lower chart on the right), TLT dropped a bit, went sideways for nearly two months and then broke down.
So this might be something to watch. We’ll put it on our radar and keep updating the situation as it unfolds.■
This article was recently published in August 16th, 2019 edition of The Option Strategist Newsletter .

© 2023 The Option Strategist | McMillan Analysis Corporation