
By Lawrence G. McMillan
The stock market ($SPX) is opening at new all-time highs this morning, fueled by a very euphoric response to perceived rate cuts coming in both Europe and the U.S. That doesn’t seem like a recipe for long-term market success, but we are concerned with how the indicators look, rather than trying to predict what a small group of central bankers might do.
Nearly all of our indicators are on buy signals at the current time, but there are overbought conditions beginning to appear. Since early 2018, every time that $SPX has made new all-time highs, it has been accompanied by extreme overbought conditions that quickly wear on the market. We will see if this time is any different. There is support on the $SPX chart at 2900, and at several other areas below there. Furthermore, if the rally persists to clearly break out to new highs, then there should be support at 2940-2950 as well.
At new highs, there isn’t any classic resistance, of course, but $SPX is now moving above the +4s “modified Bollinger Band” (mBB). Today, $SPX will close above that Band if it closes above 2943, which is a high probability. If that happens, then another mBB sell signal will occur later, when $SPX eventually closes back below the +3s Band.
Equity-only put-call ratios remain on buy signals, as they are declining on their charts. Call volume has been fairly heavy in the past few days, so they are declining more rapidly now.
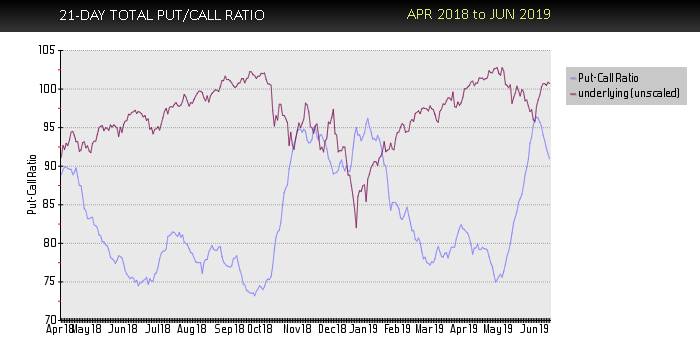
The Total put-call ratio remains on a buy signal as well. That signal has once again worked very well, as the 100-point $SPX target has now been reached...
Read the full article, published on 6/20/19, by subscribing to the Daily Volume Alerts now.
© 2023 The Option Strategist | McMillan Analysis Corporation