
By Lawrence G. McMillan
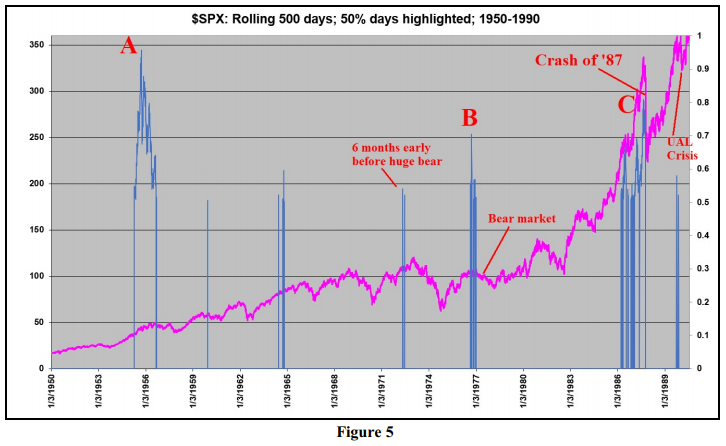
This is something that we’ve written about twice before – first in 2011 (Volume 20, No. 16) and later in 2013 (Volume 22, No. 15). In short, one measures the advance in the $SPX Index over a 494-day span (trading days). If it has risen 50% or more over that time, it is a major overbought warning. However, to use it effectively as a timing tool is difficult, for the market can continue to advance (five times since 1950, the advance has reached 70% in that time period – of which four were relatively major tops). Moreover, there can be long periods of time (weeks or maybe even a couple of months) where the measure flits above 50%, then below, then above, etc. for a while. To make this computation, you need to keep “rolling” the figures ahead. So, for example, if one were comparing day 500 of your data to day 1000, that would be the calculation for day 1000. The next day, you’d compute the advance from day 501 to 1001, etc. For the purposes of this article, we’re going to term this the “roll:” the difference between two days in the market that are 500 days apart...
Read the full article by subscribing to The Option Strategist Newsletter.

© 2023 The Option Strategist | McMillan Analysis Corporation