
By Lawrence G. McMillan
The post-Thanksgiving seasonally bullish period ended at the close of trading on January 3rd. This period is a combination of three different seasonal patterns, which began at the close of trading on November 22nd (post-Thanksgiving, January effect, and Santa Claus rally). $SPX advanced 116 points, or 4.5% over that time period. One component of our research indicates that it is usually best to be in the small-caps during this period. However, this year the Russell 2000 ($RUT) only advanced 36 points, or 2.4%. IWM advanced by 3.56 points, also 2.4%. So this year it would have been better to be in $SPX all the way along, rather than in the Russell.
What happened to the “January effect?” That’s the period of time when small caps outperform large caps. It got its name from the fact that about 30 years ago (and prior to that), traders sold off small-cap losers near year-end. That was an altricial depressant, so then (other) traders bought them back after the first of the year. During that buy-back phase, the small caps outperformed the large-caps. That occurred in January and was thus termed the “January effect.” But when the success of this strategy (buying depressed small caps in January) became well-known, traders started buying them earlier to get a jump on the crowd. Eventually, the January Effect moved into mid-December. This year, however, it was even earlier it seems.
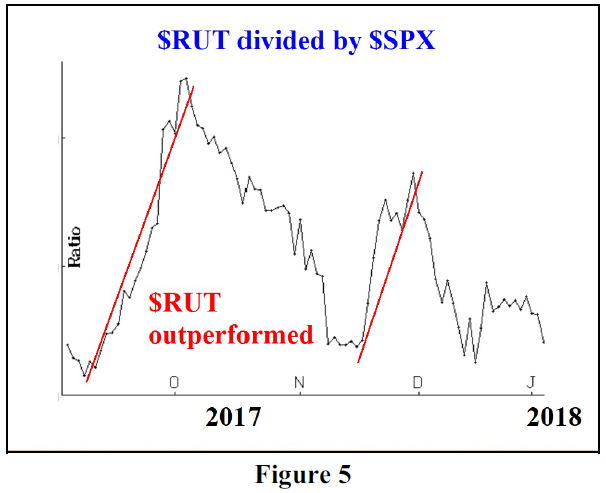
Figure 5, above, shows the relative performance of $RUT and $SPX over the past few months. You can see that $RUT outperformed during most of September, and then outperformed again in late November. However, from Thanksgiving onward – which is when we were in our trade – the chart in figure 5 declined sharply in early December and was not able to recover. That means that $SPX was outperforming at those times.
Does this mean that the January Effect has now moved into November? I think it’s too early to say that. Perhaps there just weren’t that many small-cap losers that needed to be sold this year, so the accompanying buy-back never had a chance to occur. In any case, we will add this data to our composite graph, and that uses a longer-term history to determine where the January Effect is located.
The Santa Claus rally period ended with the close of January 3rd, 2018. $SPX moved higher during this period. It started at 2684.57 and is closed at 2713.06, a gain of 1.1% – slightly below its average gain of 1.4%, but a gain nevertheless. So, the potential negatives of a failed Santa Claus rally period are not apropos. Thus, another potentially bearish indicator falls by the wayside.
With the end of the seasonal period, we would expect less “panic buying,” but it doesn’t mean the end of buying altogether. It’s not a sell signal.■
This article was featured in the 1/5/2017 edition of The Option Strategist Newsletter.

© 2023 The Option Strategist | McMillan Analysis Corporation