By Lawrence G. McMillan
Sellers got the upper hand yesterday, on fears of what Fed Chair Yellen might say in her speech on Friday morning. Or at least the excuse that is being given. $SPX closed below its 20-day moving average for the first time since June 29th – a period of 39 days. These long periods of “levitation” above the 20-day moving average are not exactly common, but they occur with enough frequency that we can analyze them. In general, the market moves higher after the period of “levitation” ends – especially when it has lasted this long. We have published data on this phenomenon before, and will update it again now that the current streak has ended.
Ironically, the upper “modified Bollinger Bands” moved higher because volatility increased and the 20-day moving average is still moving higher as well. The 4σ Band – which is what we’ve been using as a target for this rally – is currently at 2209 and rising.

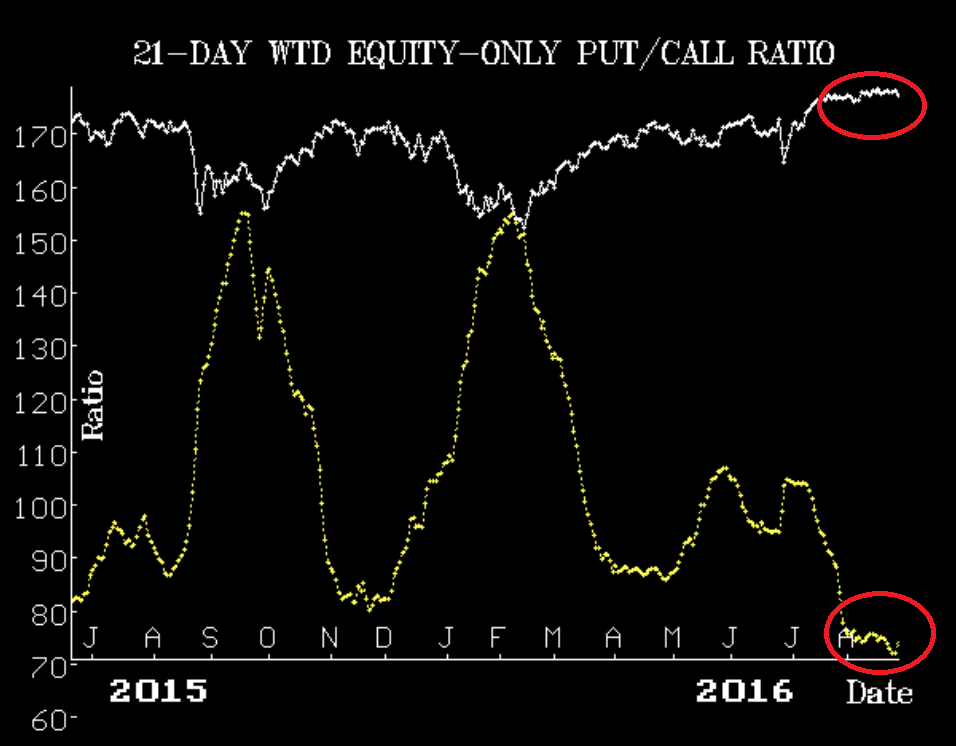
Equity-only put-call ratios are now split in their outlook. The weighted ratio rolled over to a sell signal after yesterday’s action, which included some rather heavy put buying. The standard ratio is still on a buy signal, though...
This excerpt was part of the market commentary featured in this morning's edition of The Daily Strategist. Sign up for a free 7-day trial today to read the article in its entirety.
© 2023 The Option Strategist | McMillan Analysis Corporation

