By Lawrence G. McMillan
Composite Implied Volatility (CIV) – for an individual stock – is calculated by weighting the individual implied volatilities of each option that traded on that stocks, by volume trading and by distance in- or out-of-the-money (at-the-money gets the most weight). We calculate this daily and store it in a database. Later, then, it is a simple matter to determine the percentile of the stock’s CIV by comparing the most recent reading to the past 600 (or whatever) readings.
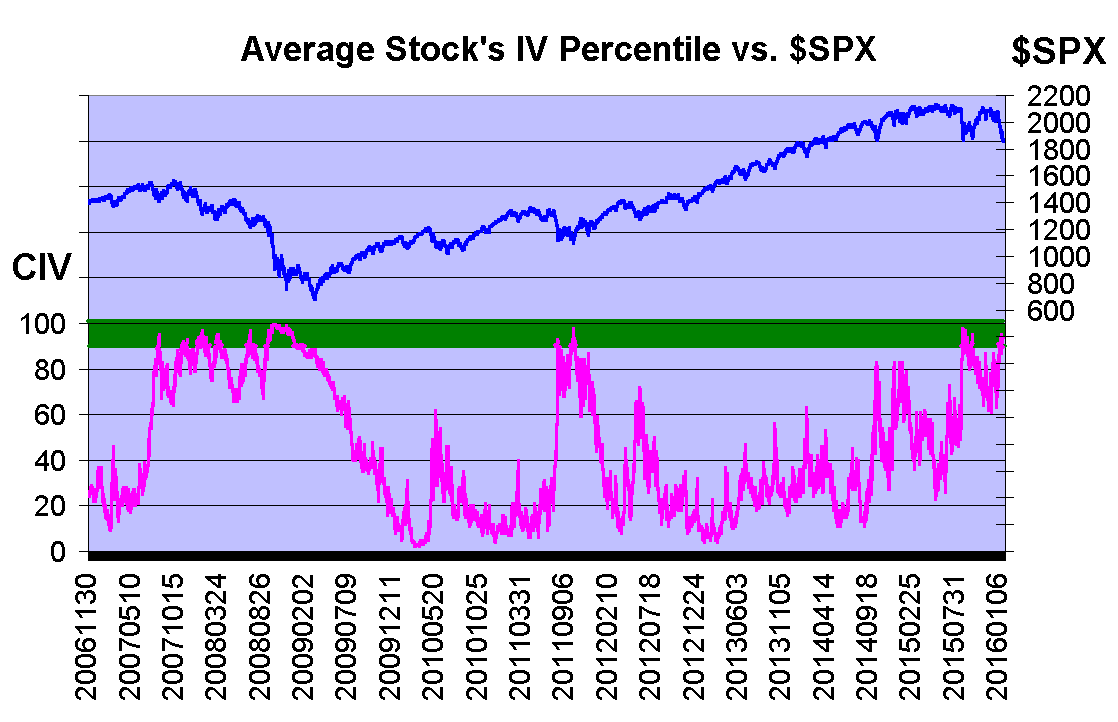
We can then also do this for all stocks that trade options and come up with the average CIV for all stocks. Currently the average CIV is in the 94th percentile. That is the average stock option is very expensive. This is not too surprising, of course, since the market has plunged, and falling stock prices generate higher volatilities – both realized and implied.

Figure 5 shows the graph of the average CIV going back to 2006. The $SPX scale is on the right, and the CIV percentile scale is on the left (CIV ranges from 0 to 100). When the average CIV gets above the 90th percentile, the market is extremely oversold. A buy signal is generated when it later falls below the 85th percentile (i.e., in Figure 5, when it falls below the green band). You can see that there were several buy signals generated during the bear market of 2007-2008. Most of them led to sharp rallies and good gains, even though there was an ongoing bear market. The buy signals in 2011 led to a long bull market. Now, we are entering our second buy signals of this current time (one occurred in September 2015). To me, this is an indication that the market is behaving more like 2007-2008 than like 2011, but only time will tell. This indicator has not given the buy signal yet.
This arcticle was orignally published on 1/21/16 as part of The Option Strategist Newsletter. Receive the articles when they are first published, along with specific trading recommendaitons by subscribing today!
© 2023 The Option Strategist | McMillan Analysis Corporation

