By Lawrence G. McMillan
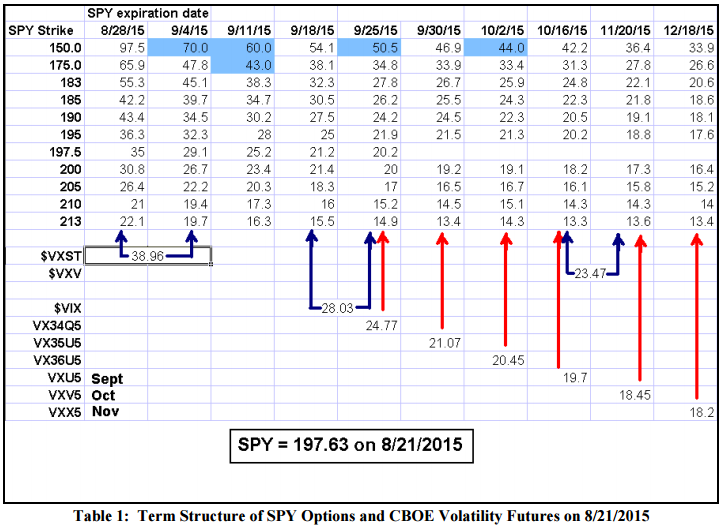
One of the great things about trading is also one of the worst things – the market can spring things on you that you never saw coming. Even if you were bearish, you certainly didn’t expect this kind of reaction (or if you did, I submit you’ve been bearish for a long time). In volatility trading, surprises can occur as well – and they have done so this time, as well. In this article, we’re going to take an in-depth look at the term structure and what has happened with volatility derivatives as the Standard & Poors Index ($SPX) imploded while the CBOE’s Volatility Index ($VIX) exploded (as did the other CBOE Volatility Indices – $VXST, $VXV, and $VXMT). These relationships are not only important in understanding the nuances of volatility trading, but in stock market analysis as well.
Volatility Derivatives At Deep Discounts Recap
On Tuesday, August 18th, $VIX was benignly sitting at 13.79. The next day it edged a little higher, to 15.25. But this wasn’t even a breakout of its own trading range, although it was close. At the same time, $SPX dropped 17 points to sit right on its support level at 2080. Then the explosions occurred. $SPX dropped through the 2080 support, falling 44 points to 2035, violating the longstanding trading range support at 2040. $VIX responded by jumping to 19 – high, but not outrageous...

Read the full article (published 8/28/15) and get the complete trading recommendations by subscribing to The Option Strategist now.
© 2023 The Option Strategist | McMillan Analysis Corporation

