
By Craig Hilsenrath
Wtih the recent release of Option Workbench 2.1 we have planned to publish three blog posts detailing the various new features. In today's article - the second in the series - we will be providing some information on Using Fat Tail Distributions.
Using Fat Tail Distributions
The Delta Risk chart has gone through a number of upgrades in Version 2.1. The profit graph is superimposed over the lognormal PDF on which increments of price change in standard deviations are marked.
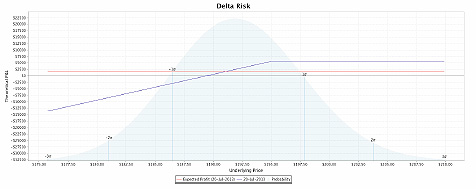
The chart above illustrates the range from -3 to +3 standard deviations for a covered call position. The detail table that appears while the mouse is being dragged over the chart has had several new columns added.
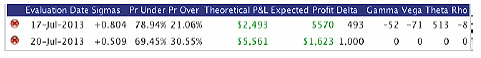
- Sigmas - The number of standard deviations above or below the selected price on the Evaluation Date.
- Pr Under - The probability of the underlying price being below the selected price on the Evaluation Date.
- Pr Over - The probability of the underlying price being over the selected price on the Evaluation Date.
- Expected Profit - The expected profit of the strategy on the Evaluation Date.
Each of these is dependent upon the historical volatility selected in the Volatility Shifts dialog.
The red line on the Delta Risk chart shows the expected profit for the nearest evaluation date selected. The date is noted in the legend at the bottom of the chart.
To select a fat tail distribution, open the Volatility Shifts dialog and click the Fat Tail radio button as shown below.
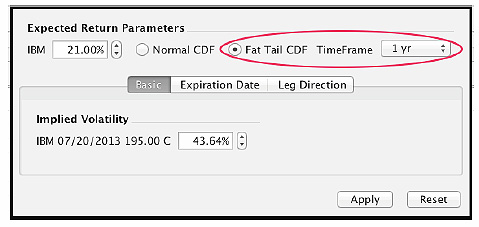
Use the Time Frame drop-down menu to change the time frame used to generate the CDF. After clicking the Apply button, the expected profit and return value(s) will reflect the selected fat tail distribution.
The Risk Report has been changed to show the underlying price at each change in standard deviations for each selected evaluation date. The calculation of the underlying price has been scaled to the log-normal distribution.
More detailed information on how to use probability and expected value can be found in the white paper written by Enhancing Option Portfolio Returns Using Probability and Statistics. It can be downloaded by visiting the aforementioned link and filling out the form on the lower right of the home page.
For more information on the new updates to Option Workbench, read the full Option Workbench 2.1 Release Notes.
© 2023 The Option Strategist | McMillan Analysis Corporation