
By Craig Hilsenrath
We are pleased to announce that Option Workbench 2.1 has been released. There are several new features in this release that improve your control over how probabilities are calculated, analyzed and used by Option Workbench. Below is some information on the new probability analysis.
Probability Analysis
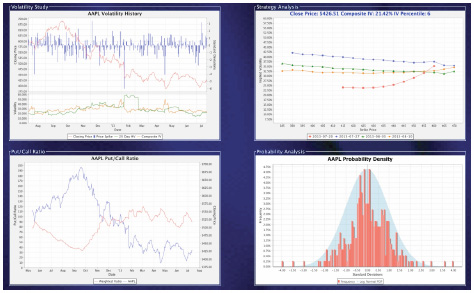
Although Option Workbench has always incorporated probability calculations, version 2.1 has a new probability module that gives you more control and choices on how those probabilities are computed and used. The Probability Analysis module is available for all assets from the Analysis Dashboard either by clicking the new link or selecting the probability chart icon on the lower right of the image dashboard.
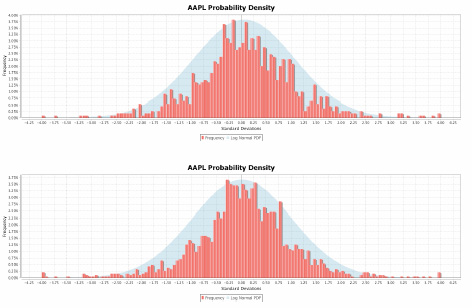
In the Probability Analysis module you will be able to examine and manipulate the empirical PDF that can be used to incorporate fat-tail distributions into the expected return calculations. The charts below show examples of 3-year and 5-year empirical probability distributions.
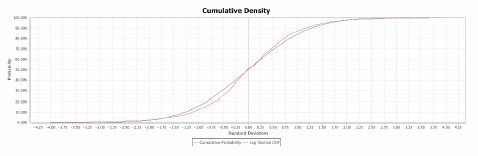
Using an empirical probability histogram, Option Workbench can create a cumulative density curve, or CDF. The CDF can then be applied as the source for the probabilities used to calculate the expected profit and expected return of any strategy under analysis. The following chart shows the fat tail
CDF derived from the 5-year PDF above.
For more information on the new updates to Option Workbench, read the full Option Workbench 2.1 Release Notes.
© 2023 The Option Strategist | McMillan Analysis Corporation