By Lawrence G. McMillan
One of most important things an option trader watches is volatility. The daily Volatility History report in The Strategy Zone offers you the data you need to be a well-prepared option trader: three historical volatility levels, plus implied volatility, and the percentile of implied volatility. Each Saturday, we offer free weekly volatility data in the free option education section of our site as well.
Volatility is measured in standard deviations, but that is a term that is foreign to most people, and even a statistician would have trouble putting it into words that everyone could understand. So the volatility figures shown in this report are best used as comparative measures. That is, if we know IBM has a volatility of 20% and Sears Holdings has a volatility 60%, then we know that SHLD is much more volatile than IBM – about three times as volatile.
Historical Volatility
Volatility can be measured in a historic manner, by using the past prices of the underlying instrument in question. It is typical to look at 20-, 50-, and 100-day historic volatilities. Other intervals could be taken into account as well. In our reports, those are the three measures used. Whatever time frame is used, the result is annualized so that once again comparisons can be made. If we see this pattern:
20-day historical volatility: 25%
50-day historical volatility: 35%
100-day historical volatility: 50%
then we would quickly surmise that this is a stock that was trading quite wildly, but has recently settled down into a tighter range. The pattern of decreasing historical volatility is what allows us to draw this conclusion.
Historic volatility is also called statistical volatility or actual volatility. It is computed by using the mathematical formula for standard deviation – a statistical formula that is well-known among mathematicians. Therefore, there is no argument over what the historical volatility is. There may be some disagreement over whether one should use the 10-day or the 100-day or some other length of data for the measurement, but the actual result is not in question.
Implied Volatility
The other volatility measure that is very important is that of implied volatility. This is the volatility that the option price is predicting. In other words, it is the option traders' estimate of the volatility of the underlying over the life of the option. Note that this is an estimate. A guess. In other words, it could be totally wrong, as far as what actually develops in the price action of the underlying in the forthcoming weeks or months.
Option traders learn to use implied volatility levels to their advantage. For example, if implied volatility is "too low" then the options would be considered cheap. Conversely, if implied volatility is "high," then the options are expensive.
Implied volatility is not computed with a formula. Rather, it is derived through an iterative process, using an option price model. A quick example may help in understanding this. An option's price is a function of six things:
Stock price
Striking price
Time to expiration
Interest Rates
Dividends (in the case of stocks and indices)
and Volatility
At any one point in time, the first five are known quantities. We can look them up in the newspaper or with the use of a quote machine. In addition, we know the price of the individual option in question. Suppose these conditions exist:
Stock price: 30
Striking price: 35
Time to expiration: three months
Interest rate: 2%
Dividends: $0.00
Price of the call: 1.50
To determine implied volatility, one needs to answer the question, "What volatility, when used along with the other inputs to the option pricing model, would force the model's result for the theoretical call price to be equal to the actual price of the call?" In this case, the answer is roughly 52%. That is the implied volatility of the 3-month call with a striking price of 35.
Composite Implied Volatility
Each day, at McMillan Analysis Corp., we analyze every option that is listed – whether it be a stock option, index option, or futures option. The implied volatility of each option is computed in this manner. From this data, a composite volatility for the underlying instrument can be computed for that trading day. Each individual option on IBM, say, has its own implied volatility. In general, they will be similar to each other, but they are not exactly the same. So we weight each individual option's implied volatility by its trading volume and its distance in- or out-of-the-money (At-the- money options receive the most weight). Thus, each day we have just one implied volatility number for each of the nearly 4000 entities on which listed options are traded.
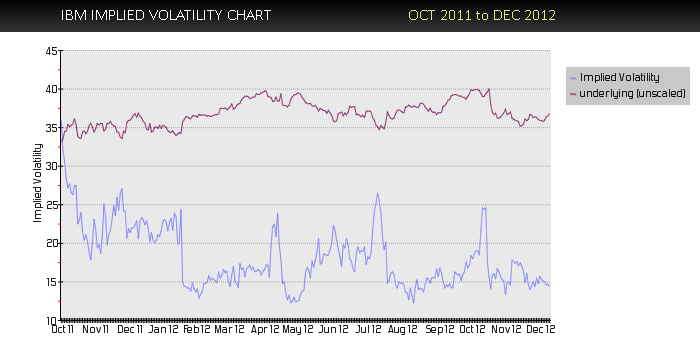
These daily numbers are then assembled in a data base, so that we can draw volatility charts or go back and see how past implied volatilities compare to today's composite implied volatility.
Percentile of Implied Volatility
The measure that we use for quickly determining whether a particular entity's options are cheap or expensive is to compute the percentile of implied volatility. Today's composite implied volatility number is compared with those in the historical database of like numbers, and its percentile is computed. Actually, even though the historical database of composite implied volatilities is large, we usually only look back 600 trading days (a little over two years) in order to determine the percentile. That seems to be enough time to get a good historical perspective without including data that is so old that it may be irrelevant.
So, if today's composite implied reading for IBM is 30% and we look at the past 600 trading days of IBM and see that today's reading is higher than 150 out of the 600 historical readings, then we would say the current implied volatility of IBM is in the 25th percentile.
The Volatility History Reports on The Strategy Zone
The above data is all presented in each of the Volatility History Reports that are posted on The Strategy Zone daily. At the beginning of the report itself, there is a summary of the column headings. You will see that they correspond to the items discussed above. There is one other item in the report. It is that date on which the options last traded. Since options don't trade on every entity every day (they may be quoted, but they don't necessarily trade), this can tell you if the options are illiquid – or possibly have been delisted.
There are three Volatility History reports:
"By symbol"
"By implied volatility"
And "By percentile"
In each case, the same data is presented, but it is sorted in a different manner. "By symbol" means that the data is sorted by the base symbol of the underlying stock, index, or futures contract. Index symbols begin with '$' while futures symbols begin with '@.' In addition to the base symbol for stocks, additional symbols are shown also – including leaps, wraps, and other symbols – up to a maximum of 30 characters on the line. If there are more symbols than can fit on that line, you can see the entire list of them in the "Option Symbols" section of The Strategy Zone, where all of the symbols for each stock are listed.
"By percentile" means that the data is sorted by the percentile of implied volatility, the definition of which was described above. The list is sorted from highest percentile to lowest. Thus, the entities at the top of the list have expensive options. Those at the bottom of the list have cheap options. This list allows you to quickly find the situations where options are expensive (top of file) or cheap (bottom of file). In addition, the Volatility Extremes Report on The Strategy Zone has a similar list with additional volatility information.
"By implied volatility" means that the data is sorted by the raw implied volatility number. This is probably the least useful measure of the group. This list shows the most volatile stocks at the top of the list and the least volatile at the bottom. Note that the composite implied volatility "caps out" at 290%. That is, if the implied volatility of the options is higher than that, we just report it as 290%. Generally, only a handful of such entities would exist in a normal market. But when times are very volatile or when there are a lot of low-priced stocks, the number of "maxed out" volatilities would be larger.
In any of the three reports, if you are looking for a particular stock, you can find it by using your browser's "find" command. Generally, the command is invoked by first clicking on Edit, then click on Find, and then type in the stock symbol you want to find. By doing the search this way, you will save time (rather than just dragging down the file until you find the stock you want).
Some Cautions About Using Volatility
While volatility is important to the option trader, it should always be used with good judgement. For example, if the options are very expensive, don't just blindly sell the options naked. There may, in fact, be a good reason why the options are expensive (perhaps the company is involved in a major litigation, or it is a biotech company that has a major drug up for review before the FDA). Conversely, if options are very cheap, perhaps the company has agreed to an all-cash buyout. Do some homework beyond the volatility analysis before establishing a trade.
Comparing Historical and Implied Volatility
Another caution: do not automatically assume that historical and implied volatility will converge over any short period of time. Eventually, they will converge, of course. But that convergence might not take place for an extended period of time. If you establish positions that expect the convergence to occur quickly, you may be disappointed – and lose money. Another section of The Strategy Zone is being prepared – one in which the implied volatility is compared to the historical volatility, and the resulting list is sorted by the ratio of the two. Look for this Volatility Comparison Report to be added "the Zone" shortly.
Summary
It is important to for all option traders to realize that volatility is a very important facet of option trading. It behooves the astute trader to know whether the options he is trading are expensive or cheap. There is not necessarily anything inherently wrong with buying an expensive option, for example. If one knows it is expensive, he knows that a decrease in implied volatility would be harmful. Therefore, he will be prepared to take action if something affects the implied volatility (such as the denial of a takeover rumor, for example). Suffice it to say that all professional option traders are aware of implied volatility and if you're not, you're at a disadvantage to them. So the Volatility History report in The Strategy Zone offers you the data you need to be a well-prepared option trader: three historical volatility levels, plus implied volatility, and the percentile of implied volatility. Also, the other volatility reports – Volatility Extremes, Volatility Skewing, and Volatility Comparisons (under construction) – give you the complete set of volatility information needed to compete in today's option markets.
Visit the Free Implied Volatility Data Page »
For volatility data on a daily basis, subscribe to The Strategy Zone.
© 2023 The Option Strategist | McMillan Analysis Corporation