
By Lawrence G. McMillan
This article was originally published in The Option Strategist Newsletter Volume 22, No. 14 on July 26, 2013.
When one says that “the market” is overbought, he really means that a number of trusted indicators are in extreme states of bullishness. Recognizing that “the market” is overbought is only moderately useful. That’s because an overbought market can still rise strongly, while remaining overbought. Things work similarly, but in reverse, for oversold markets. In fact, some of the worst declines in history (most of October, 2008, for example) came when the market was already oversold. Eventually, though, the market reverses and works off the extreme conditions.
In today’s article, we’ll identify the current overbought conditions and then make a recommendation as to how to best trade them.
Trading Market Extremes
Overbought or oversold markets can be more dangerous than “normal” markets to short-term traders. For example, if one were to short the market once he identified it as overbought, he might be standing in front of the proverbial “freight train” as the market races higher, making his short position very painful. It is not uncommon to see certain advisory services get caught in this trap. It can be even worse on the downside. In the last great bear market of 2007-2009, there were some bulls who are not “permabulls,” but even so, they never turned bearish. That’s because the market got oversold right away, and to some it seemed like it was better to wait for a buy signal or to trade from the long side. They were wiped out (well, paper accounts are never really wiped out, are they?) as the market continued to plunge.
For these reasons, we prefer to wait until an overbought condition reverses and breaks its trend before taking a position. Regular subscribers are familiar with this approach in the way we treat put-call ratio signals, for example. If the put-call ratio is collapsing (as it is now, due to heavy call buying), we would not issue a sell signal, no matter how far it collapsed, until the ratio curled over and began to rise – that is, it broke its downtrend. We use a similar approach with Daily Sentiment Index (DSI) readings, as we wait for the extremes to begin to taper off before making a trade.
That is, I firmly believe, the way to trade any of these overbought or oversold conditions. You will never “pick” the absolute top or bottom that way, but you will be in position to ride the trend if it has indeed changed. Furthermore, you also won’t be plastered to the front of a runaway locomotive as it barrels onward against your position.
We last wrote about the market being overbought earlier this year in Volume 22, No. 5. That was published on March 15th. It was more than two months later – on May 22nd – that the market actually topped out, although there was a modest correction in mid-April. So it is entirely possible that this current market won’t have a meaningful correction for another month or two, but it is useful to identify these overbought conditions now and to lay out a plan for trading them.
Current Overbought Conditions
We generally follow four major technical indicators in making broad market decisions: the chart of the Standard & Poors 500 Index ($SPX), the put-call ratios – primarily equity-only – market breadth (advances minus declines), and the CBOE’s Volatility Index ($VIX). At the current time, three of these four areas are “overbought” (the only one that is not is the put-call ratio). So, we’ll look at all of those, plus some others.
$SPX Is Overbought
How can an index be overbought, you might ask. What I mean here is that $SPX is “too far” above its trailing moving averages. Usually, when it reaches such extremes, there is a tendency for it to pull back to a more normal state. These concepts have been discussed previously in Volume 20, No. 15; Volume 21, No. 2; and Volume 22, No. 5.
Some analysts occasionally cite the percent that $SPX is above its 20-day or 200-day simple moving averages. The problem with using a straight percentage to measure whether a market is overbought or oversold is that it doesn’t take volatility into account. In a very dull market, if $SPX is 15% above or below a certain moving average, that may actually be more overbought than if it is 20% above or below that average during more volatile times. The correct way to handle this, in my opinion, is to calculate the number of standard deviations (σ) that $SPX is above or below the moving average. That incorporates volatility, and so can accurately compare one market environment with another.
Over time, we have received a number of requests as to how to calculate this figure, so here is a brief summary of the formulae. I realize this is mostly of interest only to self-avowed geeks and “do-it-yourselfers,” but here’s how I do it.
1) calculate the 200-day historical implied volatility as the standard deviation of daily price changes. Annualize that by multiplying by the square root of 255 (the number of trading days in a year).
2) solve the following equation for a, the number of standard deviations:
 S = Pe^avt
     Where P = 200-day moving average
           S = current $SPX price
           v = volatility from step 1
           t = sqrt(1/365)1
 or a = ln(S/P) / (v * t)
For reference, at the close of trading on July 23rd, $SPX was 15.95σ above the 200-day moving average. That is historically a very large distance, thus qualifying $SPX as “overbought.”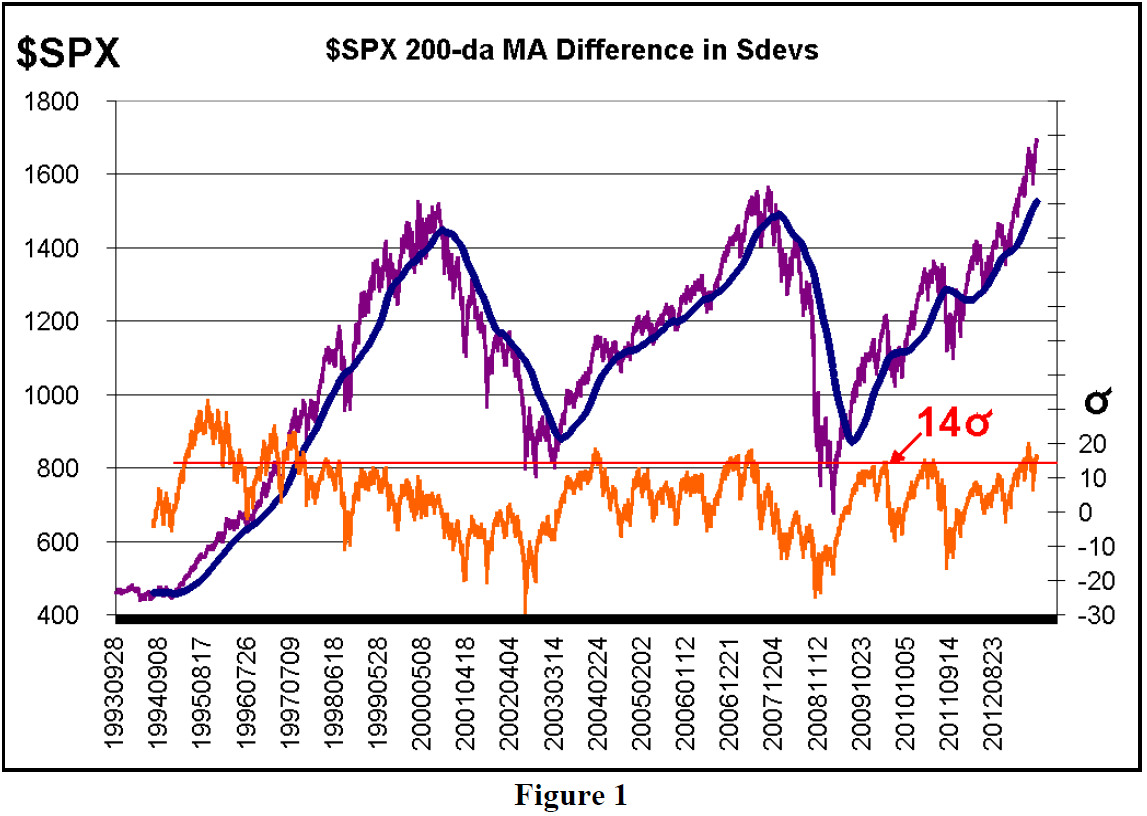
Figure 1 shows $SPX and its 200-day moving average in the dark colors, extending back to 1993. The orange, lower line is the number of σ’s that $SPX is above or below the 200-day MA. There is a horizontal red line drawn at 14σ (scale on the right). Since 1997, $SPX has had a tradeable correction every time that it has reached this 14σ threshold – not immediately, but eventually. In fact, from 1997 through this year, the most that $SPX had been above its 200-day moving average was 18σ in June of 2007. We know how that worked out – not well for the bulls.
On May 21st of this year, $SPX reached 19.8σ. There was a correction almost immediately after that, but now we are at higher highs for $SPX albeit not higher σ. Even so, it is well above 14σ currently, and that is an overbought warning sign.
I didn’t try to create an actual trading system, but it would seem that a pullback of 2 or 3 sigma from any reading above 14σ would be a reasonable point to sell.
Market Breadth Is Overbought
This is a simpler assertion to prove. We keep cumulative breadth oscillators of both NYSE-based data and “stocks only” data, where our definition of “stocks only” is the entire set of optionable stocks. At the current time, there is about the same number of stocks in each category. However, they behave differently because NYSE data includes a number of listed securities which are not stocks – ones which are generally interest-rate-related, such as convertible bonds, warrants, etc. Meanwhile “Stocks only” data not only includes all NYSE optionable stocks, but also includes a good number of NASDAQ stocks, too (the ones that have listed options).
In recent weeks, both are overbought (i.e., they are well above +200), but the “stocks only” oscillator has been far stronger than the NYSE - based oscillator.
On July 11th – two weeks ago – the “stocks only” oscillator reached +726, which was the 12th highest reading in history. Four days later, the “stocks only” reached +747, the sixth highest reading ever. The NYSE-based oscillator never reached any extreme levels during this same period of time.
Lest you reach immediately for the “SELL” button, note that in the past there has definitely been a lag time between these high readings and an eventual sell signal. In fact, through the last half of 2009, when the market was rocketing off its March 2009 bear market low, there were several readings that are still in the top 20, and there was no serious correction until May, 2010. Most of the time, though, the market tops out within two months of these extreme high readings, at most.
We have a sell signal system in place for these oscillators, so we don’t really need to guess. It is this: if the “stocks only” oscillator drops below +120, then a sell signal is issued (if the NYSE-based oscillator drops below +180, then that’s a sell also). So, while the recent overbought readings are extremely high, and that may make one acutely aware of just how overbought the market had recently gotten, there won’t be an actual sell signal until the above conditions are met.
Before leaving the subject of breadth, there was something that recently occurred that is historic: the difference between the “stocks only” oscillator minus the NYSE-based oscillator reached +300. In fact, the three differential readings on July 15th, 10th, and 12th, respectively, were the largest in history. Moreover, eight of the top 10 differentials occurred in the last two weeks.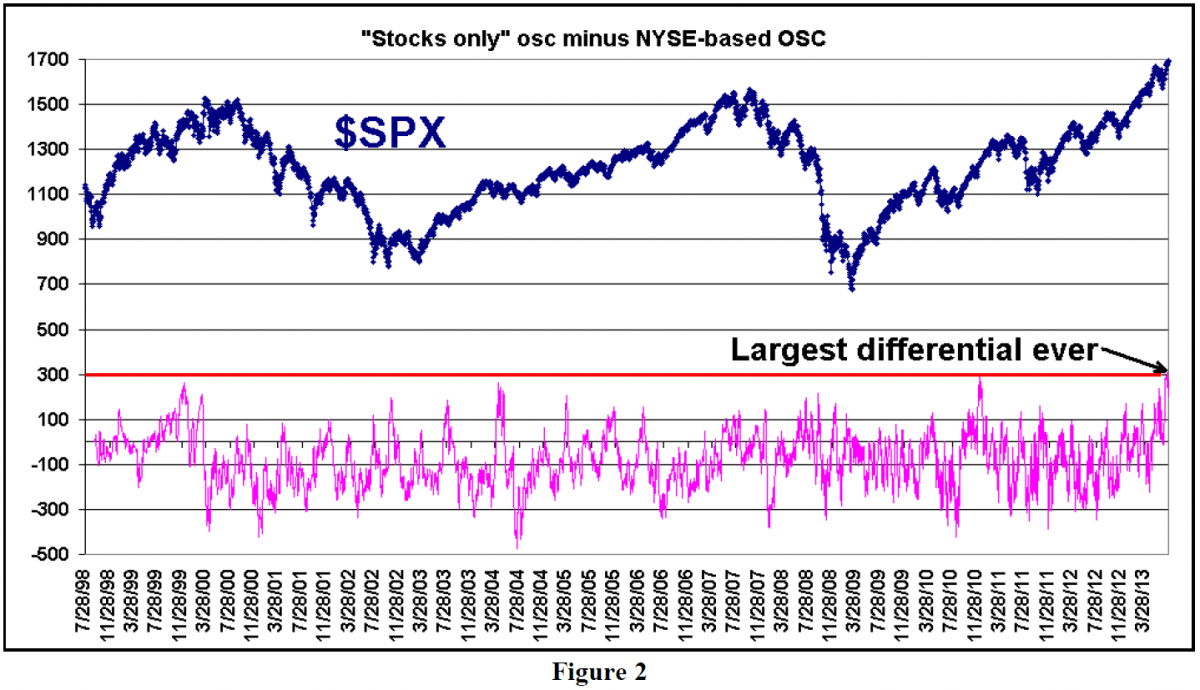
Figure 2 shows the chart of this differential (lower line) plotted against $SPX (upper line in Figure 2). The +300 line is shaded as a thick red, horizontal line. The differential has only been this large four times before: December 1999, April 2004, and December 2010. This is such a small sample that it may not be significant data, even if it is historic. In any case, the market turned down shortly after the 1999 and 2004 occurrences, but not in 2010. It continued higher for two months that time, before experiencing a correction. So, from these three previous occurrences, this does appear to be an overbought condition of sorts.
It should be noted that the difference in these two oscillators is already beginning to shrink, and it stands at +162 as of the July 24th close.
$VIX Is Overbought
The statement that “$VIX is overbought” is – similar to saying $SPX is overbought – dependent on the chart of $VIX. But here, rather than observing how far $VIX is from some moving average, we can instead merely observe the price of $VIX. $VIX has been below 10 only a few days in its 27-year backdated history. That would be an extremely overbought reading.
$VIX has not been that low this year, but it has retreated to roughly the 12 level a few times, and the market has stalled or sold off each time afterward. $VIX traded at an intraday low of 12.07 on Tuesday of this week (see chart, page 11).
Typically, we would not react to an “overbought $VIX” reading until $VIX began to rise above a significant level a few points higher. At the current time, if $VIX were to close above 15, that would be enough of a rise to register some bearish concerns.
Another measure of volatility that we follow is the Composite Implied Volatility (CIV) – specifically we track what percentile of implied volatility the average stock’s options are in. If it falls below the 10th percentile, that is an extreme overbought condition that eventually leads to a sell signal.
However, at the current time the average stock’s CIV is only in the 26th percentile. Hence, this measure of implied volatility is not overbought. I am a bit surprised by this, but the facts don’t lie.
Daily Sentiment Readings (DSI)
The DSI readings in S&P and VIX futures can be of use in identifying overbought (or oversold) conditions, too. The more extreme of these has been the VIX futures, which showed readings of less than 10% bulls on eleven of the last twelve days. The DSI for the S&P futures got as high as 87% on July 19th, but never reached the “official” overbought extreme of 90% bulls or higher. Even so, these are both significant, in my opinion. Both are nearing important signals, as S&P DSI has fallen to 79% bulls (below 75% would now be a sell signal), and VIX DSI rose to 13% bulls (above 15% would now be a buy signal). A buy signal in VIX futures and/or a sell signal in S&P futures would be bearish for the broad market.
Bonds: Government vs. Junk
Another indicator that we sometimes view is the longterm Government Bond ETF (TLT) divided by the Junk Bond ETF (HYG). This data is shown below in Figure 3.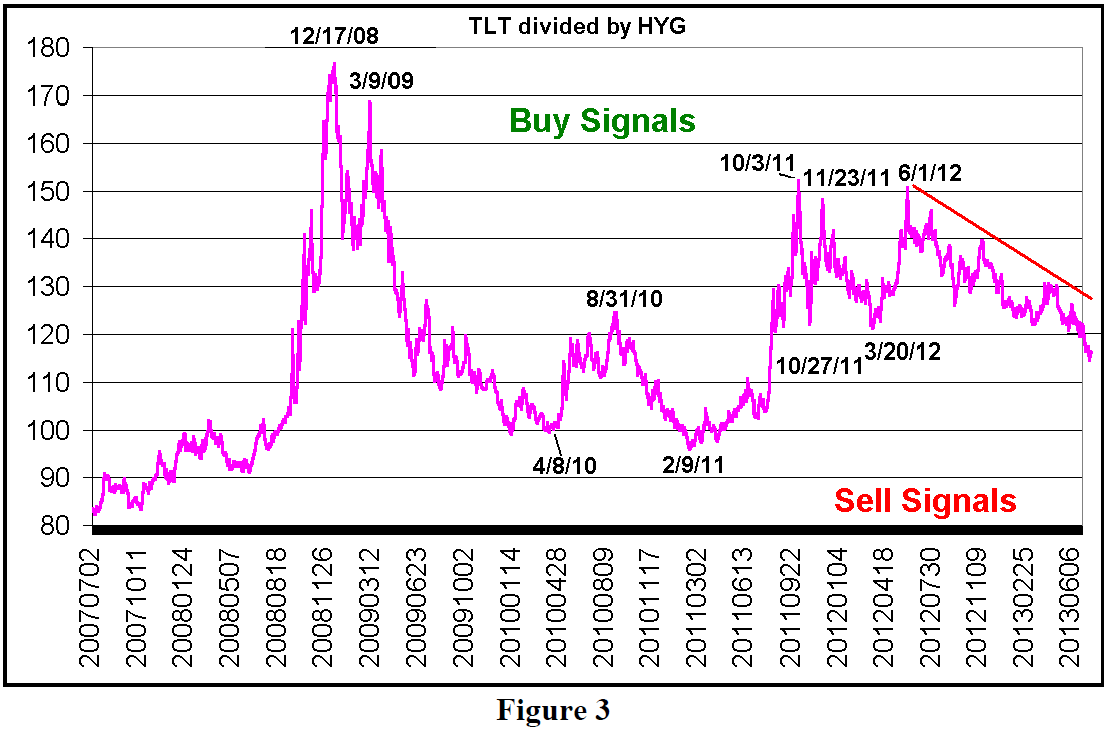
Buy signals for the stock market are given when this ratio peaks. Sell signals for stocks are given when this ratio bottoms.
As you can see, the ratio is continuing to decline, so it has not given a sell signal yet,. It is “overbought?” Well, considering that it hasn’t been this low since the summer of 2011, one could probably make a case for “overbought.” In any case, it hasn’t given a sell signal yet.
Further Anecdotal Evidence
There are other things that can alert us to an overbought market. One is the number of implied volatility charts that are posted daily to the subscriber area of our web site, The Strategy Zone. Only stocks with CIV’s above 80 or below 20 are posted. Currently there about 1,000 charts being posted. That is a fairly large number, but it was much larger back in May – easily reaching 1,500 or more charts posted daily. Hence this is not really overbought.
Other things we notice are the data used to create the Daily Volume Alerts report, including how many stocks have unusually heavy option volume, how many stocks have extraordinarily heavy stock volume, and so forth. These lists are only moderately large – not nearly as long as they were in May.
Summary
The conclusion to any article about overbought markets needs to specifically state that shorting a market solely on the basis of overbought conditions is dangerous. You may think that sell signals will soon appear, but during extremely overbought markets, they often take much longer to materialize than you might expect.
Having said that, the confluence of this large number of overbought conditions is worrisome and certainly raises the possibility of a sharp correction in $SPX, even if it is short-lived. From a more negative perspective, an intermediate-term downturn could occur if actual sell signals arise from a majority of the indicators that have been reviewed in this article.
It seems that the most likely sell signals will first be the breadth oscillators and the DSI readings. If $SPX breaks down below its first support level (1670) and is accompanied by those sell signals, puts can be bought for a trade. What would also happen if $SPX dropped below 1670, is that the “distance from the 200-day moving average” would fall below 14σ – a sell signal.
These things might be enough to push $VIX above 15, too – a more than 3-point reversal off its lows and, by inference, a sell signal of sorts for stocks.
What would really be negative, though, would be sell signals from the put-call ratios. It is likely that they would be the last to occur because they use 21-day moving averages. However, with the aid of the computer program that we use to analyze these charts, we can often spot the signal very soon after it turns (within a day or two).
This article was originally published in The Option Strategist Newsletter Volume 22, No. 14 on July 26, 2013.

© 2023 The Option Strategist | McMillan Analysis Corporation