
By Lawrence G. McMillan
This article was originally published in The Option Strategist Newsletter Volume 13, No. 2 on January 22, 2004.
In our last issue, we summarized our trading results for 2003, and compared them with the eleven previous years that we’ve been publishing. One thing that stands out is that we have a number of very large winners, which makes speculative trading profitable, even though the percentage of winners may not be all that high. What makes this happen is that we are fortunate to be in a market that is trending, and we take advantage of that by using a trailing stop – rather than, say, a target, which would limit profits in a large move.
In this article, we’ll present some concepts and techniques for trading a trending market. In addition, we’ll make a first attempt to identify which markets tend to trend the most. Of course, one never knows for sure when a market is gong to make a long, relatively uninterrupted move, but if we know which markets have that tendency, then perhaps we can be more aggressive in taking positions when other systems indicate a buy or sell signal in those markets.
I say this is a “first attempt” at identifying trending markets, because the concept is simple, but the application is difficult. So, I would expect that we will have more to offer on this subject in forthcoming issues, over the next few months.
What is a "Trend?"
Before discussing how to profit from a trend, or which markets trend, it is necessary to identify what we mean by a trend. Different styles of trading will identify different things as trends. For example, day traders will often identify a “trend day.” Mark Cook, a friend who is an excellent futures trader, identifies a “trend day” in the S&P 500 futures as a day in which they move 15 points or more.
Obviously, someone who is not a day trader would want more than one day’s action to identify a “trend.” We consider ourselves “position traders,” not day traders. As such, we look for longer-term moves as trending moves. These may last as long as several months. Defining what a longer-term trend is, is a trickier piece of business. It’s almost like the judge said in the Larry Flint trial “I’ll know it when I see it.” He was referring to pornography, of course, but the same statement can be made about longer-term trends. In general, a trending market is one that goes in the same direction for quite some time, rarely dipping more than a few percent in a small, occasional correction and generally staying above its short-term moving averages (uptrend) or below its moving averages (downtrend).
Such a nebulous definition will not work for defining a system, or for computer analysis, so we have to come up with something better. There are two simple applications that come to mind: 1) the 10-day simple moving average remains above the 20-day simple moving average all throughout an uptrend (or remains below during a downtrend), or 2) the Average Directional Index (ADX) remains above 30. Either one is an acceptable way of defining a trend. If you’re not familiar with ADX, suffice it to say that it was invented about 30 years ago by Welles Wilder and was specifically used to measure whether a market is trending or not – and how strongly it’s trending.
Trading the Trend
As mentioned briefly above, we have been able to capture some large profits in our speculative positions by virtue of latching onto trending markets. We haven’t necessarily been looking for trending markets, per se, but have at times found them after fortuitous option buys generated by put-call ratios or momentum signals (momentum signals are generally only used in our companion publication, The Daily Strategist).
No matter what method one uses to choose a directional (speculative) position, we feel that the proper way to trade a position is to cut your losses and let your profits run. This is not difficult to do. You cut your losses by 1) buying options (which limits your risk automatically to the purchase price paid), and/or 2) use a relatively tight stop. Generally, we recommend that traders not risk more than 3% of their account’s capital in any one position. Cutting your losses may require some discipline, but that is quickly learned – especially if you ignore your own stops once or twice and suffer bigger losses than you had intended.
Letting your profits run is also quite easy, but most traders make if difficult – primarily because of emotions. First, let me point out that one should not use targets. You will never benefit from a long, powerful trend if you use targets, for you will be out of your position before the trend really even gets under way. Besides that, I have yet to meet anyone who can accurately place targets at the outset of a position. Sure, it’s true that later on, one might spot a sell signal or other negative indicator and liquidate a holding, but that sell signal presumably wasn’t visible when the position was bought (more likely, buy signals existed at inception).
The proper way to let profits run is to use a trailing moving average. This can be as simple as the 20-day moving average, or something more complicated like an exponential moving average, or Chandelier stops – which are based on the average true range – or parabolic stops. These are all forms of a trailing moving average, which keeps you in a trending market until the underlying closes below the stop. The more advanced stops (Chandelier and parabolic) incorporate the stock’s volatility into the equation and will protect your gains better in a fast-rising trend. If you want to read more about these, try John Murphy’s Technical Analysis of the Financial Markets (NYIF, 1999) for information on parabolic systems and stops, and John Bollinger’s seminars for information on Chandelier stops.
In the stops we utilize for our positions (page 4), we normally use either the simple 20-day moving average or the Chandelier stop, whichever is closer to the stock price.
Identifying A Trending Situation
Since many of our best profits have come in trending markets, we thought it might be interesting to see which markets tend to trend the most. Even if we could identify which markets trend the most, that wouldn’t necessarily mean that we’d only want to trade those markets. No market trends all the time, and even those that don’t trend very often sometimes will generate one good, long trend.
Our first attempt at doing this was to look at stock price histories and see which ones spent the most time with their ADX above 30. It is generally accepted that, if ADX is above 30, then a market is trending strongly. This does produce some interesting results, which we’ll discuss in a moment. However, it should also be pointed out that due to quirks in the way ADX is computed, this definition will not suffice for trend identification for all stocks – especially lowpriced ones. Also, gaps cause a problem, as they can cause the ADX to shoot higher. Using a continuous futures contract solves the problems associated with gaps in individual futures contracts. Since indices don’t gap (or rarely gap) they are perhaps the easiest entity to analyze in this fashion.
The following table shows the best-trending stocks, indices, and futures. We required at least 600 trading days worth of data, and did not include any days on which a stock was trading below $10 per share (the “low-priced problem”). It is certainly fair to compare them amongst their peers. That is, it is fair to say that Eurodollar futures are the best-trending futures. However, it is not necessarily correct to compare the percentage of days that Eurodollars have an ADX above 30 with, say, the percentage of days that the Russell 2000 Index has ADX above 30.
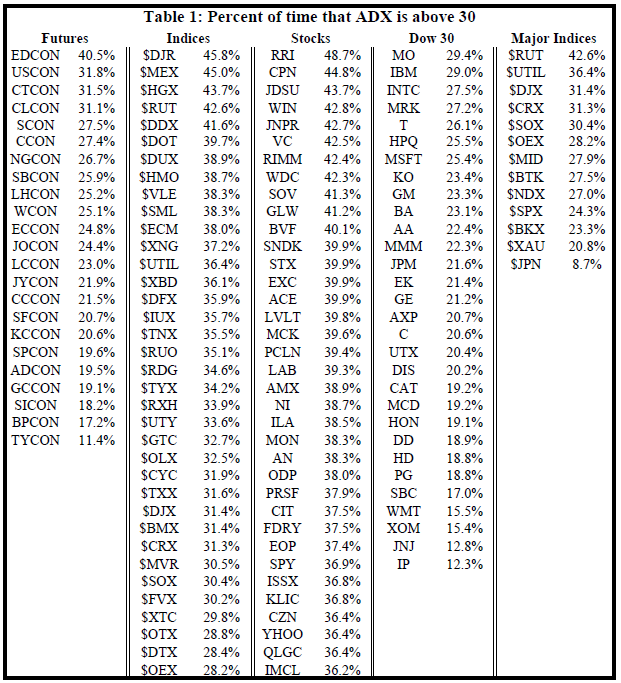
The first two columns in the table show the results for futures contracts (continuous contracts, which is why “CON” is in each symbol; so “USCON” is the continuous contract for US, or T-Bonds). My instinct, before performing this analysis, was that futures trend better than stocks or indices, but that is apparently not the case – at least not under this definition. Most of the futures contracts have ADX above 30 less than 30% of the time, and only Eurodollars are higher more than 32% of the time.
Indices, on the other hand, tend to trend much better. The table only shows the top 35 indices or so, but you can see that they all trend 28% of the time or more. $DJR is the Dow REIT Index, and it may come as something of a surprise that it’s trending best. This index was created about five years ago and has spent a good deal of the time in long-term trends (all of 2003, for example, has been an uptrend).
The third set of figures is stocks. Since there are so many stocks, and some are quite illiquid, we put another filter on this list: the stock must have averaged a million shares per day or more over the last year. Even with that criterion, the names in the center set of columns are hardly household names. Remember that we did not count time spent under $10 per share, but even so, a number of these stocks are relatively low-priced, and even a $10 stock can boost ADX by having wide (percentage) trading ranges.
The final two sets of columns are merely to show where some of the familiar names fall in comparison to the other data shown in the table. The Dow 30 stocks (4th set of data from the left) are well below the other stocks shown in the table, as well as being lower than most of the futures and indices as well. Thus, these big-cap stocks don’t trend very well. The final columns of data show the trending percentage for some of the major indices. Interestingly enough, the $DJX (Dow-Jones Industrials) trends more often than any of its components. That just shows that an index can behave differently than its individual components. Small cap indices have trended well ($RUT), but so have utilities ($UTIL), which may not be a big surprise since REITs have trended well also.
Summary
We are going to consider how best to use this information in trading. One way might be to use a slightly looser stop in an entity that has a good history of trending – figuring that we don’t want to take ourselves out of a trending situation too soon. In addition, we are going to expand this study in the future to include other definitions of “trending,” to see if this ADX approach is verified.
This article was originally published in The Option Strategist Newsletter Volume 13, No. 3 on January 22, 2004.

© 2023 The Option Strategist | McMillan Analysis Corporation