By Lawrence G. McMillan
This article was originally published in The Option Strategist Newsletter Volume 20, No. 3 on February 10, 2011.
Most traders are familiar with the concept of averaging down. It is almost a mantra as far as long-term investment strategies go; buyand- hold funds and investors often feel they are getting a bargain when they get a chance to average down. However, the strategy can be a disaster in certain circumstances.
A much less popular strategy is “averaging up.” This is not something that stock traders often do, but futures traders are often more comfortable with it, as they look to maximize or increase gains in a winning trade.
In this article, we’re going to look at both philosophies to see if either, neither, or both belong in the trading arsenal of a sophisticated trader. Let’s begin with definitions:
In this entire first part of the article, it is assumed that all positions are long, not short. So “averaging down” and “averaging up” will be discussed with respect to bullish positions. We will discuss short positions later.
Averaging Down
To “average down” is to buy more of the same stock (or option or futures contract) at a lower price. In other words, your first purchase is now losing money, and you are going to add more to the position to lower your overall average cost.
This is an important point: by definition, when you average down you are adding to a losing trade. This concept alone makes the thought of averaging down anathema to some – including some very famous traders, most of whom are primarily futures traders. Futures involve a lot of leverage, and adding to a losing position with leverage can lead to severe problems.
But it’s not just futures where averaging down can be a foolish strategy, although one would not know it right away. For example, there are many stocks that are 90% or more off their all-time highs (some even went bankrupt). Averaging down in these situations could prove ruinous.
Each time you average down, you are tying up your capital in this losing trade – preventing you from using it for perhaps a more viable situation (such as buying a stock that is not in a severe downtrend). Not only would one be tying up all his capital in a stock that continues to sink, he would be piling up big losses all the way along.
In its purest form – averaging down consistently and over a long period of time – one cannot even use a stop loss, because at the point where one might stop himself out of this losing trade, it’s time to average down again. The following chart shows just one stock – Beazer Homes (BZH) – where averaging down over a long period of time would have proven to be a complete disaster. Not only did it fall from 80 to 1, but it hasn’t even recovered much since hitting the lows.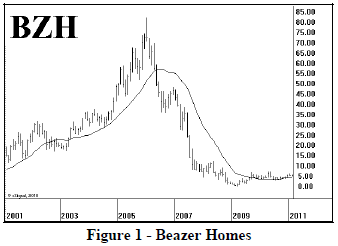
So, this is the worst scenario for averaging down. But are there any advantages? Yes, there can be. For example, if a stock declines for a while, during which time you are averaging down, and then it rebounds a little – you can breakeven at a much lower price.
Example: you buy 200 XYZ at 40. Later the stock declines to 38. You buy another 200 at 38, and you continue to buy 200 more shares each 2 points down. Finally, after falling to 34, the stock has a retracement rally to 37. How have you done?
Trade        Size & Avg Cost of Position
B 200 @ 40   200 shares   40.00
B 200 @ 38   400 shares   39.00
B 200 @ 36   600 shares   38.00
B 200 @ 34   800 shares   37.00
So, after buying 800 shares, your average cost is 37. A rally back to 37 thus gets you even (less commissions).
But was it worth it? You tied up $29,600 in capital (37.00 x 800 shares). Is that better than perhaps sticking with the original investment of $8,000 and say stopping yourself out for a small loss of a couple of points? Then you could use the rest of the money to buy a stock that’s going up instead of down.
This is not, in my opinion, a very good scenario for using the “average down” strategy, either. You are still chasing a stock that’s in a downtrend, hoping for a rebound. Eventually, most stocks do rebound, but this is a tough and seemingly undisciplined way to trade.
As long as we’re on the subject, let’s spend a moment to discuss the actual strategy of averaging down. There are two things that you must determine: 1) how many shares to buy and 2) at what price. It is not necessary – and probably would be rare – to buy the same quantity each time. Although using a fixed price interval (such as the 2-point drops in the above example) is common.
The more shares you buy each time, the lower your average cost will be, but your average cost will always be higher than the stock price at the time you average down.
Example: As one example, suppose that you buy double the amount of shares each time:
Trade        Size & Avg Cost of Position
B 100 @ 40   100 shares   40.00
B 200 @ 38   300 shares   38.67
B 400 @ 36   700 shares   37.14
After the three purchases, a relatively small rally of 1.14 will get you even (but you’re still buying a stock that is in a downtrend).
Consider one more example, where one buys fewer shares of stock at each new purchase:
Trade        Size & Avg Cost of Position
B 200 @ 40   200 shares   40.00
B 100 @ 38   300 shares   39.33
B 50 @ 36    350 shares   38.86
In this case, your breakeven is quite a bit higher than the last purchase price – now requiring a rally of 2.86 points to break even. But at least your are putting smaller amounts of money into a bad situation each time.
To summarize the above examples, one can lower the average cost of the entire position more by buying more shares each time. However, this is a Martingale strategy1 and eventually the stock could drop so far that you run out of money to keep averaging down in larger and larger quantities.
Perhaps a better use of averaging down would be within the context of a more constructive chart pattern. Suppose that you see a stock break out to the upside. But, before you can buy it, it has exploded much higher. A recent candidate might be something like Lululemon (LULU). Consider the chart in Figure 2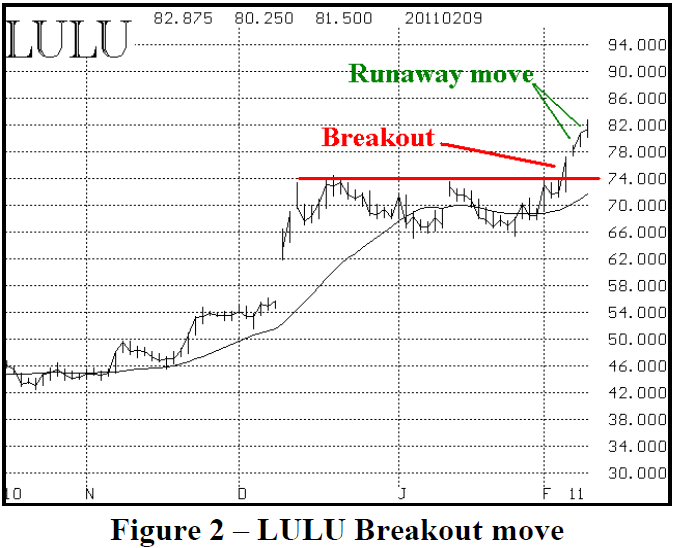
LULU broke out over multiple resistance at 74, on February 4th. Suppose you noticed the breakout and decided to try to buy the stock on a pullback. However, it did not cooperate. In fact, it gapped higher the next day and kept running higher for three more days – finally reaching 82 or so by that time. The stock has left you behind, and you are frustrated that you didn’t just pay up for it on the first or second day.
However, perhaps an averaging down strategy could be used here. The stock chart would still be bullish as long as LULU is above 74. So you could buy stock at the current price (near 82) and, if the stock continues on higher, fine. However, if after you buy it, the stock then pulls back, you could average down until you reach the support level at 74. Eventually, if it closed below 74, you would declare this a “false breakout” and stop yourself out of the whole position.
So, in this context, you are averaging down, but only as long as the stock chart is generally bullish. Once the breakout is negated by a close below the original breakout point of 74, you give up on the entire position.
In general, I think this is the best use of “averaging down.” You don’t just keep holding onto and adding to a position in a losing stock, but if the stock has a pullback within the confines of a generally bullish pattern, “averaging down” can make sense.
Averaging Up
Averaging up, in the context of a bullish (long) position is not merely the opposite of averaging down. Rather, it is the practice of buying more of the stock (or futures or options) as it is moving up. That is, you are adding to a winning position, pyramiding on the upside. The idea is to maximize your profits in a situation where you are in a long, bullish trend.
Even though this is rarely discussed in stock trading seminars, it is often a topic in futures trading seminars. For some reason, long-term stock strategists don’t seem to mind averaging down, but they seldom mention averaging up.
Figure 3 shows a familiar entity that has been on a bullish tear of late – the S&P 500 SPDRS (SPY).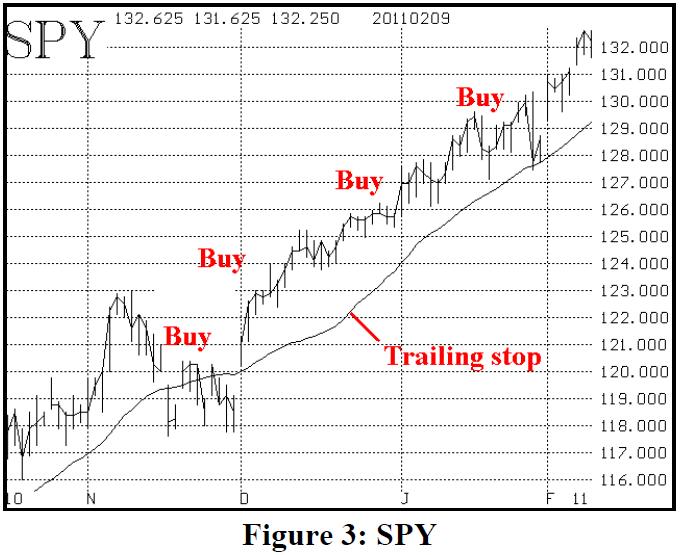
One of the nice things about averaging up is that you can still treat a position as you normally would – with a trailing stop to exit the position. So, in Figure 3, a trailing stop is shown as well.
Example: suppose you bought 100 SPY at 121 on December 1st, 2010. Since then, SPY has not closed below the trailing stop, so the holder is not stopped out.
Furthermore, suppose that you averaged up every three points – buying another 100 shares at 124, another 100 at 127, and another 100 at 130. After these four purchases, you would own 400 shares at an average cost of 125.50.
You can see that you are earning more and more money as SPY continues on higher. At the right-hand side of the chart, SPY closed at 132.25, so your unrealized profit is $2,700 (as opposed to a profit of $1,125 if you had merely held the 100 shares you bought at 121).
Your stop, at the right-hand edge of the chart, is at about 129.25, and that is above your average price of 125.50. Hence, even if you are stopped out, you will still earn $1,500 (3.75 per share), as compared to $825 you would have earned had you merely held the original 100 shares and sold them at 129.25.
Note that in averaging up, your average cost is always below the price at which you buy more stock. Hence you are always adding to a profitable position.
You might correctly point out that this still entails your adding more and more money to the position. That is true in stock trading, although in a more leveraged environment such as futures trading, the accumulated profits can be used to buy more contracts.
The biggest disaster scenario for a trader who is averaging up is a slow steady rise (during which you buy more shares) followed by a large downside day – perhaps even a gap down – that plunges the underlying below your average cost price. This scenario could occur with stocks that are reporting earnings, for example. It can be mitigated a bit by applying the strategy to broad-based ETF’s (such as SPY) because they don’t really gap much, but the principle is the same. Figure 4 shows what happened in SPY last May.
Example: suppose you had bought 100 shares of SPY at 112 last February, and added 100 shares each time SPY traded two points higher. You would have bought at prices all the way up to and including 122 by late April. Your position at that time would be long 600 shares owned at an average cost of 117. If you had waited until SPY closed below the trailing stop, you would have stopped yourself out at 117 and change, just before the disaster of the “flash crash” occurred.
Even so, this would be a disappointing result, for you wouldn’t have made much of anything even though you were in the position for nearly two months.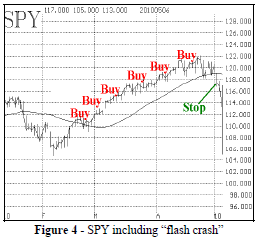
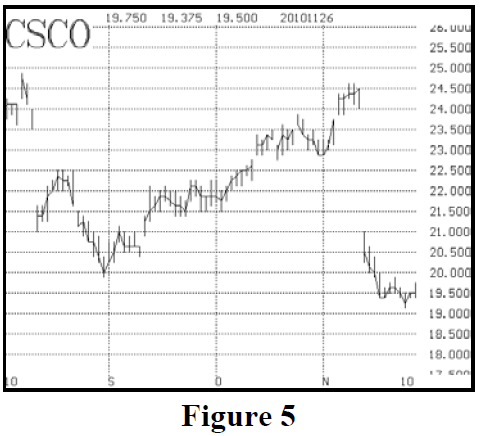
While this is not a pleasant outcome, it could have been mitigated, perhaps, by using a tighter stop. And it is better than what might happen in an individual stock, as shown in the Cisco (CSCO) chart in Figure 5. We saw earlier that the trader has control over the quantity and the price at which he averages. One way to mitigate the problems in Figure 4 would be to buy fewer shares on each average up. This wouldn’t maximize upside profits as much, but would still provide for a better result than just buying the original position and holding it.
Using Options
Averaging up or down with options presents additional problems, mostly related to the time decay of the position. Rather than buying more of the same option, one would more likely roll up (when averaging up) or down to a greater quantity each time.
The problem is that if the underlying stock backs off just a bit, your entire position could expire worthless. There is no way to completely eliminate that, but one might try to stay with an in-the-money strike. For example, when rolling up, make sure your strike is less than or equal to your trailing stop price.
Bearish Positions
The entire previous discussion was from the viewpoint of the buyer of the underlying. However, bearish traders (short sellers) can average up or down as well. T h e principles are similar. A short seller who averages up is shorting more stock at a higher price – thereby adding to a losing position. There is a real danger that the underlying could rise by hundreds of percent, and entirely wipe one out. So this is really quite dangerous unless applied within the context of a bearish chart, using a stop if the chart loses its bearishness.
A short seller who averages down – i.e., who sells more stock as the price drops – is adding to a winning position. That is more viable, but its biggest problem is the slow decline followed by a huge upside gap.
Summary
Most investors average up and down and probably don’t think much about it. This would be true if one is investing a fixed amount of money each month, perhaps through a 401K Plan. Each month, one is thus buying more (of the “market”) at a different price. But that’s just a technicality; this 401K investor is really not thinking about averaging as a specific strategy.
For the purpose of the individual trader, though, averaging up or down is a more crucial decision. Averaging down really only makes sense within the context of a bullish chart that is having a pullback. Averaging up is more viable, but the risk is that a large reversal move will wipe out all your profits and more.
I am a strong proponent of the philosophy of trying to make as much as possible from a long, extended move. A few huge winners can make for a successful trading account, even if there are many more small losers.
We have written articles in the past that show how detrimental taking partial profits is to that philosophy. So is using targets. Even rolling options up – while not reducing your quantity – costs you something in upside profits each time you do it.
The proper thing to do is to use a trailing stop and stick with your position. However, as traders, it is very difficult to watch profits accumulate and not want to take them. That’s why I don’t really object to rolling options up occasionally to take some credits out of the position.
Averaging up is in this same vein. It will help maximize upside profits in a strong uptrend. But you really have to get your head around this, because most people cannot just sit idly by and watch profits build up. They feel compelled to reduce risk – odd, when the underlying price is telling you the opposite – but that’s the way of the trader. So, if you can handle it, averaging up is something that you should consider.
This article was originally published in The Option Strategist Newsletter Volume 20, No. 3 on February 10, 2011.

© 2023 The Option Strategist | McMillan Analysis Corporation