
By Lawrence G. McMillan
This article was originally published in The Option Strategist Newsletter Volume 5, No. 3 on February 9, 1996.
While speaking at two locations last week — Futures Magazine's "Futures South" and Option Vue's Seminar — it became apparent that traders and investors want guidance on money management. Not only do they want trade recommendations, but they want some guidance in the realm of how much to invest in a position, and how to properly place stops.
The number one rule of money management is that you should invest more heavily when you are winning and should reduce the size of your trades when you are losing.
This is an important concept that was first illustrated to me many years ago in a book I read that detailed the life of the famous gambler, Nick the Greek (not Jimmy the Greek). Nick was a well-known gambler who had many interesting stories and who mainly played casino games and bet sports. Nick believed in progressive betting, and so should you. In progressive betting, you increase your bet each time you win, but if you lose, you return to your original bet size.
One night when not much was happening in a particular Las Vegas casino, Nick was standing at a craps table, when a Nebraska farm boy entered and bet $1 on the pass line. He won. He then bet $1 again and won again. The farm boy ran off one of the most amazing streaks Nick had ever seen — he rolled 28 straight passes (even if you're not a casino gambler, you should understand that winning 28 straight wagers on any casino game is a pretty remarkable feat). Then he lost. The farm boy had netted out $27 and he left.
Nick, on the other hand, had started with a $10 bet, and had won $40,000 by the time the farm boy was done with his remarkable streak. Nick did this with progressive betting. He increased his bet each time that he won, eventually betting massive amounts — all of which was the house's money — near the end of the streak. If there hadn't been a table limit, Nick might have broken the house itself on a streak of that length.
The power of progressive betting is very strong. Mathematicians have attempted to apply this same thinking to the stock market, and specifically to how much to invest in a trade. The main difference between the casino bets and the stock market investments is that you normally have more than one stock market investment going at a time. So you aren't getting a series of sequential results, but your results are mixed together. Also, it's easy to know when a casino game ends — the shooter passes or craps out, or the card player wins or loses, but in the stock market, only you are in control of how each investment ends.
Larry Williams, one of the most successful futures traders ever, suggest a straightforward method of increasing your bets: each time you make $5000, trade another contract on each order. Thus, as your account equity builds up, you will be trading more and more contracts. A more theoretical approach is available, as well:
Back in the early 1950's, a scientist at Bell Telephone Laboratories was working on a problem. He needed a formula to determine the optimum usage of lines in a telephone cable. His name was J. L. Kelly, Jr., and in 1956 he published his findings in a technical journal on information theory. When the results of Kelly's analysis were applied to gambling, this money management system became known as The Kelly System. It has since been adapted to the stock market as a money management system as well.
In reality, the Kelly system was designed for use on items which have only two results (win or lose, true or false, on or off, etc.). This works very well for gambling, but not so well for the stock market. However, with a little adapting, its principles are applicable to the stock market also. The Kelly System assumes that you are going to bet a fixed percentage of your bankroll on each item. If you are making money, your bets will grow in size as your bankroll does. On the other hand, if you hit a bad streak and are losing, the Kelly System automatically reduces your actual bet size as the value of your bankroll decreases.
Here is the original Kelly formula in its simplest form:
Amount of bet = (W + L) × p – L

where W = amount you could win,
      L = amount you could lose,
  and p = probability of winning.
For example, in a situation where you risk one "unit" and pay a 10% "commission", the amount you could win (W) would be 1.0, while the amount that you could lose (L) would be 1.1. This reflects the 10% "commission", which is typical in sports betting. With these values for the variable, the Kelly formula would read:
amount to bet = 2.1p — 1.1
So, in order to use the system, you would only need to know what your probability of predicting winners is. For example, if you can predict winners under this criteria at a 60% rate, the Kelly system would tell you to bet 2.1 × 0.60 - 1.1 = 0.16, or 16% of your total bankroll on this one bet. This particular version of the Kelly formula also tells you that if you can't predict at least 52% winners, then bet nothing.
The Kelly formula can't be directly applied to the stock market, because results are more complicated. Each trade doesn't produce a complete loss or a 100% profit, less commissions, as sports or casino betting does. A stock, futures, or option trade can have an infinite number of outcomes. Therefore, we have to adapt a little to use the Kelly formula. We not only have to gauge the probability of having a winning trade, but also have to take into account how big the wins and losses are. That is, we have to factor the average return into the Kelly formula. In this case, the Kelly formula becomes:
Amount to risk = ((r + 1) × p – 1)
                           r
     where p = probability of winning
   and r = average win/average loss under this strategy
(assuming that you invest an equal amount in each trade)
Alternatively r can also be the ratio of the average rate of return on winning trades divided by the average rate of return on losing trades. With this alternative definition, you don't have to assume an equal investment in each trade.
For example, if you are analyzing an S&P futures day-trading system, most system designers will give you the percent of winning trades and the average win and average loss. This information can then be plugged directly into the Kelly formula.
Suppose that we have the historical results of a trading system, and that is has produced 30 winners and 45 losers. That is a probability of winning of 40%. In addition, we know that the average winning trade produced a profit of $1500, and the average losing trade lost $500. This is all the information we need in order to use the Kelly formula (p = 40% and r = 3).
    Amount to risk = ((3 + 1) × 0.40 - 1)
                              3
                   = 0.20
Thus, the Kelly criteria says that we should invest 20% of our total funds in each trade, when using this strategy.
This is very useful information, as it allows one to increase the size of his trades when his account size is increasing, and it forces one to cut back on the size of his trades when the system is losing. Despite that benefit, the Kelly criteria has a problem in that it assumes that you are investing sequentially. That is, you are using the system for one trade at a time.
If the Kelly criteria told one to invest 20% of his funds in each one trade, what would he do if there were more than 5 trades that needed to be positioned at one time? One solution might be to trade on margin, but a more conservative approach would be to use what is called the risk-adjusted method. In this method, the amount one invests in a trade is the Kelly percentage of the available equity in the account.
Suppose, as above, that we computed the Kelly criteria, and it says to invest 20% of our capital in each trade. Then, incorporating the risk-adjusted method into the trading would result in the following amount of capital being invested in each trade.
Trade    Available       Capital        Available
Number   Capital Before  Invested       Capital After
         This Trade      In this Trade  This Trade
1          100%             20%            80%
2           80%             16%            64%
3           64%           12.8%          51.2%
etc...
Thus, if Kelly says to invest 20%, then the first trade would consume 20% of your whole equity. That leaves 80% of your equity to be invested. The next trade would then be 20% of the available equity — or 20% of 80% (16%) of the entire account. In terms of the whole account, 20% would be invested in the first trade, and 16% in the second trade, leaving 64% of the account as available equity. The third trade would require 20% of 64%, and so forth.
Using the risk-adjusted method even allows one to combine different strategies (which presumably would have different Kelly percentages). For each new investment, he merely uses the appropriate Kelly percentage and applies it against the remaining equity in the account, in order to determine how much to invest in any particular trade.
In summary, then, the Kelly criteria can be coupled with the risk-adjusted method to produce a useful and impartial way to help one manage his money as he establishes each new position.
Money Management Through Stops
The number one flaw that most people have in their trading is that they don't take enough risk. This is quite vividly demonstrated by some information that Jake Bernstein, of MBH Commodity Advisors, presented at the Futures seminar. He showed two charts, similar to those that follow.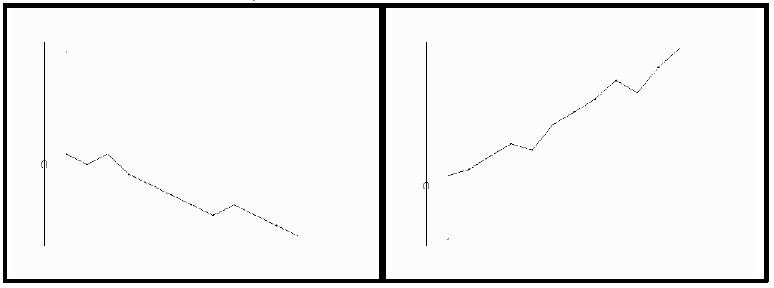
These are the results of an S&P futures trading system, employed in two ways (the lines are the total equity in the account over time). The chart on the right is obviously a very successful system, as it has been building up profits for a long time. The one on the left, however, has been a loser, and the account's equity is just about wiped out.
There is only one difference in the trading system used to generate these two widely disparate results: the size of the stop. In the profitable case, each contract was given quite a bit of room, as the stop was set at $2500 (5 points). On the left, the stop was one point, or $500.
This means, simply, that the S&P's are too volatile and can fluctuate one point against you with ease, thereby constantly stopping you out for your very limited loss. On the other hand, the system itself is successful, but you need to let it have enough room to roam.
This same philosophy is applicable to all positions. That is why, for example, we use stops of 1% or 2% on our OEX positions. It seems like a lot of distance with OEX above 600, but the computer back-testing has shown us that these are the best numbers to use for stops.
This article was originally published in The Option Strategist Newsletter Volume 5, No. 3 on February 9, 1996.

© 2023 The Option Strategist | McMillan Analysis Corporation