
By Lawrence G. McMillan
This article was originally published in The Option Strategist Newsletter Volume 19, No. 4 on February 25, 2010.
We have recently recommended a couple of butterfly spreads involving earnings situations, while in the past we’ve used dual calendar spreads. In addition, we sometimes use straddle purchases for other events – such as FDA hearings. Butterflies and calendars are apropos for FDA events as well. In this article, we’re going to refine which strategy is best for which situation, for each has its own merits and deficiencies.
As an initial step, let’s lay out some definitions – for completeness, as we usually do in articles in this publication – so that those who are not yet familiar with the concepts can follow along. “Event trading” is the act of establishing an option position in advance of a corporate event, where that event is expected to produce a (large) gap move in the price of the underlying stock. Most commonly, these events are earnings announcements. The next most common event is that of a biotech stock reacting to an FDA ruling or to the announcement of the results of drug trial testing. Less frequently, there are lawsuits. Takeover rumors don’t normally fall into this category, for they are much less certain; the others are events which are certain to happen at some point in time.
Option traders are well-informed, in general. Thus, options are normally expensive in advance of these events, since traders anticipate that the stock will likely experience a strong, probably gap, move after the event’s outcome is known.
Outright Option Purchase
One is always free to take an outright long position in either puts or calls in advance of the event. This is highly risky trading, though, for it is usually quite unclear what the event is actually going to produce. Will earnings be better or worse than expected? Even if one knows what the earnings will be, what about the dreaded earnings forecast, which always accompanies the earnings report? In FDA hearings, will the FDA approve or not, and – if so – are there conditions attached? As for drug trials, even the date is unknown, let alone the results. The companies are very careful about keeping secret the data and the results of the trial.
Thus, the uncertainties of these event outcomes make the outright purchase of put or call options a very risky proposition. Hence a strategist will look for option strategies that can profit under a certain number of event outcomes, without necessarily having to predict the actual outcome itself.
Straddle Buying
To that end, let’s discuss the simplest strategy – the straddle purchase. With this strategy, one buys both a put and a call. Thus, if the event causesa sufficiently volatile move in the underlying stock – in either direction – a profit can result.
We have done studies in the past, and typically this strategy produces positive results whether the event is earnings- or FDA-based. The last time we conducted a detailed study, earnings-based straddle buying produced an average profit of about 9%. That’s not great, but it’s better than losing. According to the same study, FDAbased straddle buying produces an average profit of about twice that amount. That’s the main reason we have often attempted to buy straddles in front of the FDA events that we follow (see page 7 for this week’s list).
As an aside, note that straddles could be sold, if one thinks that the option market has overpriced the event. However, this is a highly risky strategy, for event-based moves can be larger than expected. For example, Google (GOOG) rose 95 points on an earnings announcement in April 2008 (the straddle had been priced around 35 the day before). FDA events are even more perilous, for they can sometimes produce moves of –75% or more or +200% or more. For example, Rigel Pharm (RIGL) tripled in price in one day (from 8 to 24) in December 2007. Such moves are typically far larger than the pre-event straddle price. But for those who wish to sell options, the other strategies may offer some opportunities.
Butterfly Spread
A butterfly spread is a limited risk position that uses three different striking prices. It makes its maximum profit at the center striking price, so one would typically locate that at the price where he expects the stock to be after the event is announced.
There are three ways to establish butterfly spread, all of which are equivalent.
- Buy 1 call at lowest strike Sell 2 calls at center strike Buy 1 call at highest strike
- Buy 1 put at lowest strike Sell 2 puts at center strike Buy 1 put at highest strike
- Buy 1 put at lowest strike Sell 1 straddle at center strike Buy 1 call at highest strike.
The third version is probably the best in terms of liquidity and price efficiency, since it deals only with at- and outof- the-money options. The other two forms necessitate using one in-the-money option, which could be quite illiquid if it’s far enough in-the-money. However, we do not leg into these spreads, but rather enter all the legs at once at a price limit, so market makers can fill the order, perhaps leaning on an equivalent position of their own.
In the third case, one can easily see that a butterfly is the sale of a straddle and the purchase of “wings” to protect against an adverse move.
In any case, the profit graph of the butterfly spread has the following shape: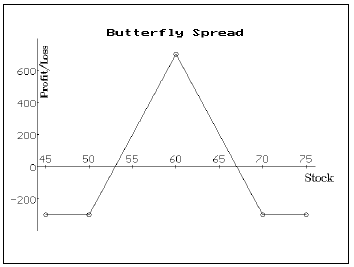
In the example shown in the above graph, the lowest strike is 50, the center strike is 60, and the highest strike is 70. The trader paid $300 for this spread – that is his risk. In cases I and II above, he would be paying a debit of $300 to establish the spread. In case III, he would receive a credit of $700 to establish the spread. In all three cases, the maximum risk is $300, so that is the margin that should be charged by your broker. Thus, the risk in the butterfly spread is 100% of the money invested! Consequently, one should limit risk in the usual way – by only placing a small, fixed percentage of one’s assets in any individual high-risk situation.
There are several ways to use the butterfly spread in an event-driven strategy. First of all, if one thinks that the option market has overpriced the event, one might want to establish the butterfly spread with the center strike near the current (pre-event) stock price. This would have worked fairly well in many FDA situations this year, since several have had moves of far less size than the option market had predicted – not to mention that the FDA has delayed a couple of hearings beyond the original PDUFA date, and that has hurt short-term option prices as well (which would aid the butterfly spread).
Some traders prefer to use this “non-movement” strategy with earnings announcements, since they are often less volatile than FDA-related events
However, if the event causes the underlying stock to experience a sharp, gap move, the butterfly centered at the pre-event stock price will not do well. What can one do in this case? In the past, we have discussed this problem, and that is how we originally arrived at the dual calendar spread strategy: if we expect the stock to either be significantly higher or significantly lower, then we should position ourselves to make money if that does indeed happen.
Hence, once could use dual butterfly spreads centering one below the current stock price and one above. In the absence of any other specific information, one could use the price of the near-term straddle as an indication of how to position the butterflies.
       Example:Suppose that XYZ is trading at 50, and
          an event is due. Furthermore, suppose that the
          nearest-term straddle – the March 50 straddle –
          is trading at 10. Then one would establish two
          butterflies, one with a center strike of 40 and
          another with a center strike of 60 (allowing for the
          10-point move either way from 50).
This strategy has certain problems, though. One is paying a debit for both spreads, so that even if one spread profits, the debit of the other spread will reduce that profit. It is probably best to exit the spreads soon after the event is announced, rather than waiting all the way to expiration. We will address when to use this strategy after we describe the calendar spread strategy.
Calendar Spreads
Another strategy that we use for events is the calendar spread. Typically, the near-term options are very expensive heading into an event. The longer-term options are less expensive. Hence the strategy of selling the expensive near-term options and simultaneously buying the less expensive longer-term options has a certain theoretical appeal. That strategy is a calendar spread.
The calendar spread strategy makes its maximum profit if the underlying is exactly at the striking price of the calendar when the near-term options expire. So, if one is using calendar spreads in an event-driven situation, it is probably unrealistic to expect the stock to be unchanged from its pre-event price. Hence, we regularly employ dual calendars – using a call calendar spread with a strike higher than the current pre-event stock price, and a put calendar spread with a lower strike.
Choosing the Strategy
So, which strategy should be used when? Essentially, from a strategic (theoretical) viewpoint, it comes down to observing the pricing of the options. If there is a large skew (difference in implied volatility between the nearterm and mid-term options), then a calendar spread might make sense, but only if the mid-term options are not overly expensive as well.
The following two examples will illustrate the concept. In July, 2008, Two stocks – Merrill Lynch (MER) and Microstrategy (MSTR) – were due to report earnings at about the same time. The two charts that follow show an implied volatility chart above a stock price chart for each stock in mid-July.
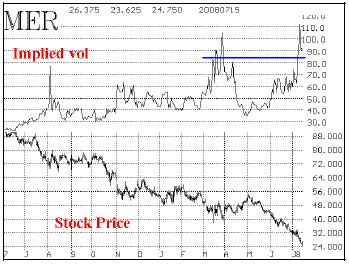
MER implied volatility had risen from around 40% to nearly 100%, due to several factors, one of which was that the earnings were soon to be reported. There was a huge skew in the MER options:
- August options: 100% implied vol, on average
- October options: 85% implied vol, on average
Normally, when there is a 15-point differential in August and October options, a calendar spread looks very attractive. However, the skew is not the only piece of information upon which one should base his decision.
Note the blue line on the chart of MER. It is drawn at 85% implied volatility – the current volatility level of the October options, which you would be buying if you were to use a calendar spread. MER options have hardly ever been above 85%. As a result this does not look like a good purchase, for there is too much risk that after the earnings, the mid-term, October, options could plummet in implied volatility and fall far below 85%. That would be devastating to a calendar spread and would certainly cause losses. Hence the calendar spread is not a viable strategy here.
Now, consider a similar chart for MSTR:
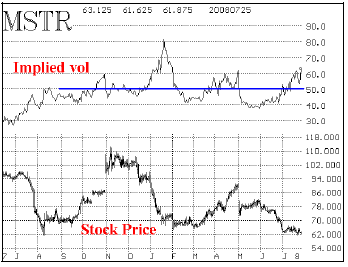
Implied volatility has risen from 40% to about 60% as the earnings date approaches. As of this date, there was also a skew in the MSTR options:
- August options: 63% implied vol, on average
- October options: 50% implied vol, on average
A blue line at the 50% implied volatility is drawn on the chart. You can see that MSTR options often trade with an implied volatility at or above 50%. Hence, paying that level for October options is okay. So we would use the dual calendar spread for MSTR. If fact, we did and the position made decent money.
As an example of an FDA-related event that just occurred, consider the situation in Salix Pharm (SLXP), which had a PDUFA date this week – on Tuesday, February 23rd. The options were expensive and skewed prior to the event. In fact, on Friday, February 19th, the FDA staff released a “briefing document” (as they usually do, a day or two in advance of the event). That briefing document raised several potential negative issues with SLXP’s application, and the stock fell a total of about 4 points on that Friday and on Monday, February 22nd. Then the stock was halted during the day of February 23rd, as the public FDA hearing took place.
- Prior to the PDUFA date:
- March options: 135% implied vol
- July options: 70% implied vol
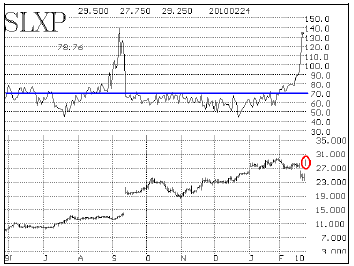
The blue line on the chart, drawn at the 70% level of implied volatility, shows that the July options were only modestly overpriced, while the March options were extremely expensive. So, we recommended calendar spreads in our daily letter, Daily Volume Alerts. At the time (Monday), the stock was trading near 24, and the near-term March 25 straddle was selling for 7. So we bought July-March call calendars with a striking price of 30 and bought July-March put calendars with a striking price of 17.5 – both strikes being about 7 points from the current stock price (24). As it turns out, the red circle on the above graph shows that the stock opened near 29 after the FDA approved the drug (despite the negativity of the briefing documents). The spread was exited the next day, as the July options held their premium very well, while the March options’ implied vol collapsed.
Butterflies vs. Calendars?
But what about butterflies vs. calendars? How do we differentiate between those two strategies? Simply stated, if you expect a large drop in implied volatility (which we normally do after the event occurs), but all the options are expensive (as the MER October options were), then a butterfly spread – probably a dual butterfly spread – makes sense.
The calendar spread strategy depends on the skew for a good deal of its profitability and it also demands that the longer-term options hold value. The butterfly, however, only cares that implied volatility drop. It doesn’t really care what happens to the longer-term options, for they are not part of the spread.
So, this simple table should help decide which strategy is best (it is assumed that near-term options are expensive):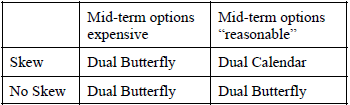
It is interesting to note that the butterfly is applicable in 3 of the 4 situations, however the “no skew” scenario is fairly rare.
This article was originally published in The Option Strategist Newsletter Volume 3, No. 23 on December 8, 1994.

© 2023 The Option Strategist | McMillan Analysis Corporation