
By Lawrence G. McMillan
This article was originally published in The Option Strategist Newsletter Volume 1, No. 2 on January 9, 1992.
All strategy recommendations made by "The Option Strategist" have a graph accompanying them that displays the delta of the entire position. Moreover, this graph also displays how the delta of the position is expected to change as the stock moves up or down in price. This article describes the position delta and how to best use it, especially for follow-up action.
The delta of an option is the amount the option changes in price for a 1-point move in the underlying security. However, the term "delta" may also refer to the exposure that a entire option position has with respect to movement in the underlying common stock. This second usage of the term "delta" is sometimes referred to as the equivalent stock position (ESP), or as the equivalent futures position (EFP). To differentiate between the two terms, the delta of the option is generally referred to as "option delta" while the ESP or EFP is called "position delta". The position delta can be computed according to the following simple equation:
Position delta = option's delta * shares per option * option quantity.
Shares per option is generally 100 for most stock options, except those affected by a previous stock dividend or stock split. For futures options, the term "shares per option" would be replaced by "shares per contract", which is always 1. By summing the above calculations for each item in a position, or even in an entire option portfolio, one can approximate how much market exposure the entire option position has.
As a means of demonstrating the usage of position delta, the Archer Daniels Midland (symbol:ADM) straddle recommendation in the first issue will be used as an example. The position is simple enough that the concepts can be demonstrated without getting overly complicated.
When ADM was at 30, the recommendation was made to buy 10 Mar 30 calls and to buy 12 Mar 30 puts. The initial recommendation was made at the following prices and deltas:
Option                     Option   Position
                           Delta    Delta
Long 10 ADM Mar 30 calls   0.56     +560 shares
Long 12 ADM Mar 30 puts   -0.44     -528 shares
Net position delta:                 + 32 shares
Note that puts have a negative delta, indicating that they move in the opposite direction from the underlying security. The total position delta of this straddle is equivalent to being long only 32 shares of ADM -- almost nothing -- and hence the position is nearly delta neutral (a position is delta neutral if the position delta is zero).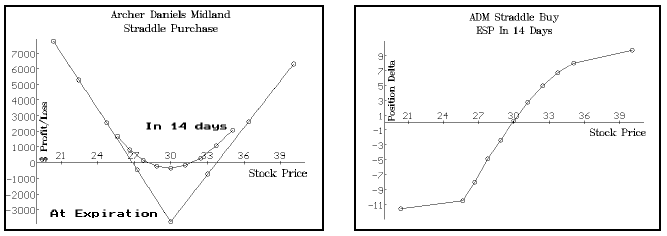
Since the position is a long straddle (with a couple of extra puts), the delta grows larger as the stock rises and becomes negative as the stock falls, thereby meaning that the position no longer remains neutral as the stock moves away from the striking price. The strategist who is managing the above position knows that his delta will change in this manner, but he should be aware, in advance, of how much change there will be in his position delta so that he can plan appropriate follow-up action. There are mathematical ways to quantify this change in delta, but a simple way is to calculate the position deltas for various stock prices in advance. It is this type of calculation that is presented, graphically, with each strategy recommendation made by this publication.
In order to see how to best use these graphs of position delta, again consider the ADM example. The two graphs above show the initial situation. The one on the left shows the profit potential of the position, while the one on the right shows how the delta is expected to change as the stock price changes over the two weeks after the recommendation was made. The overall position was destined to become long 500 shares with ADM at 32½, and to become short 500 shares if ADM fell to 27¾. If the stock rose even farther, to over 39, the position would be long over 900 shares. On the other hand, a massive drop in stock price to below 21 would have made the position delta short over 1100 shares. All of these observations are readily discerned from the graph on the right above.
In order to avoid having too much market exposure, part of the recommended follow-up action was to place an order to sell short 500 ADM at 32½, should the stock rise that far. In fact, ADM did trade at that price, and 500 shares should have been sold. How did that sale affect the position? The graphs on the top of the next page display the situation after ADM has moved to 32½ and 500 shares have been sold. The graph on the left (next page) shows the profit picture of the new ADM position, including the sale of the 500 shares. Note that the new graph shows the effect of the sale of stock: the upside potential is lessened (although it could still be substantial) and the downside potential is increased. The strategist has locked in some money by having sold the 500 shares. Another observation can be made: the loss near 30 seems over the short-term is worse than was projected in the above graph. That is due to two things. First, the projected "14-day" profit line is being drawn three weeks later in time, and time decay takes its biggest toll near the striking price. Second, the market price of ADM options has gotten even cheaper, so the new graph on the next page takes into effect the current market pricing of the options. The profit and delta projections used by "The Option Strategist" will always be based on the current market pricing of the options, unless otherwise stated. Part of the initial reason for buying this straddle was that the options were cheap compared with the historic volatility of the underlying stock. Now they are even cheaper, even though the stock jumped over 10% in just three weeks!
The graph on the right on the next page shows the projected position delta of the current position, including the sale of the 500 shares of ADM. Note that it still has the characteristics of a straddle -- getting longer as the stock rises and shorter as the stock falls -- but now the maximum position delta attained will be near 500 shares on the upside, while the position could become delta short 1700 shares on the downside. Moreover, the strategist can plan further follow-up action, such as covering the 500 shares should ADM fall back to 30 (see graph), for that is where the current position would be short the equivalent of 500 shares of ADM. Covering the short sale at that point would return the straddle to a neutral position.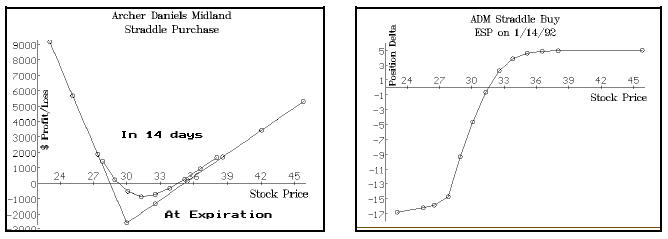
In summary, the strategist should be aware of how his position delta changes over time and with changes in the price of the underlying security. The graphs presented with strategic recommendations are to be used for this purpose (it is not necessary to be so aware of position delta in a speculative, option buying situation). Of course, the follow-up recommendations that are made will be based, at least partially, on these projections of position delta.
This article was originally published in The Option Strategist Newsletter Volume 1, No. 2 on January 9, 1992.

© 2023 The Option Strategist | McMillan Analysis Corporation