
By Lawrence G. McMillan
This article was originally published in The Option Strategist Newsletter Volume 9, No. 18 on September 28, 2000.
While the title may look like a typo, it’s what we want to talk about. In order to discuss the implied volatility of a particular entity – stock, index, or futures contract – we generally refer to the implied volatility of individual options or perhaps the composite implied volatility of the entire option series.
This is generally good enough for strategic comparisons. However, it turns out that there might be other ways to consider looking at implied volatility. In particular, we might want to consider how wide the range of implied volatility is – that is, how volatile the individual implied volatility numbers are that we use in our analyses.
Some explanation is in order, of course. Let’s start out by defining a few of the terms that we’ll be using. Long-term readers are probably familiar with these terms, but it doesn’t hurt to review them, in order to make sure that everyone is on the same page. First of all, an option’s implied volatility is the option market’s estimate of the volatility of the underlying instrument during the life of the option. Then one can combine the individual option implied volatilities at a given time (say, the end of the trading day) to compute a composite implied volatility for the underlying. Finally, we often talk about the percentile of implied volatility. That percentile describes where the current composite implied volatility lies with respect to a series of past composite implied volatilities.
Example: suppose XYZ’s current composite implied volatility is 40%. That 40% figure is arrived at by weighting the individual option implied volatilities of all the XYZ options that trade – perhaps over 100 of them – to distill them down to just one daily figure. Furthermore, suppose that we have a database of XYZ’s daily composite implied volatilities extending back 600 trading days (it could be a larger database, but we generally use 600 trading days in determining the percentile). When comparing today’s 40% reading with the 600 readings that are in our database, we find that the current implied volatility reading is greater than only 60 of the readings in the database. Hence we would say that the current implied volatility of XYZ resides in the 10th percentile.
We often use this percentile in determining whether the options are cheap or expensive. In the above example, where the XYZ volatility is in the 10th percentile, we would say that today’s reading of 40% is well below average. Something on the order of the 90th percentile or higher would be required for us to say the options are ‘expensive,’ while a composite implied volatility below the 10th percentile would be considered ‘cheap.’
By the way, note that I do not compare historical volatility with implied volatility in order to determine if an option is cheap or expensive. There is no reason to believe that, in the short run, implied and historical volatilities will converge. It’s often erroneous – even dangerous – to make such an assumption.
The Range of Volatility
However, even with all of that computation, we are still missing a fairly important ingredient. We can’t really tell if these ‘cheap’ options are cheap as a practical matter. That’s because we don’t know how tightly packed together the 600 implied volatility readings are that are in our database. For example, if we were to discover that the entire range of implied volatility for XYZ stretched only from 39% to 45%, then 40% – while low – might not seem all that attractive. That is, if the1st percentile of XYZ options were at an implied volatility reading of 39% and the 100th percentile were at 45%, then a reading of 40% is really quite mundane. There just wouldn’t be much room for implied volatility to increase on an absolute basis. Even if it rose to the 100th percentile, an individual XYZ option wouldn’t gain much value because its implied volatility would only be increasing from about 40% to 45%.
However, if the distribution of the 600 numbers in the database is wide, then we can truly say the options are cheap. Suppose, rather than the scenarios presented in the previous paragraph, that the range instead stretched from 35% to 90% – that the 1st percentile for XYZ implied volatility was at 35% and the 100th percentile was at 90%. Now, there is a large range above the current reading into which the options could trade – thereby potentially increasing the value of the options if implied volatility moved up to the higher percentiles.
What this means, as a practical matter, is that one really not only needs to know the current percentile of implied volatility, but he also needs to know the range of numbers over which that percentile was derived. If the range is wide, then an extreme percentile truly represents a cheap or expensive option. But if the range is tight, then one should probably not be overly concerned with the current per-centile of implied volatility.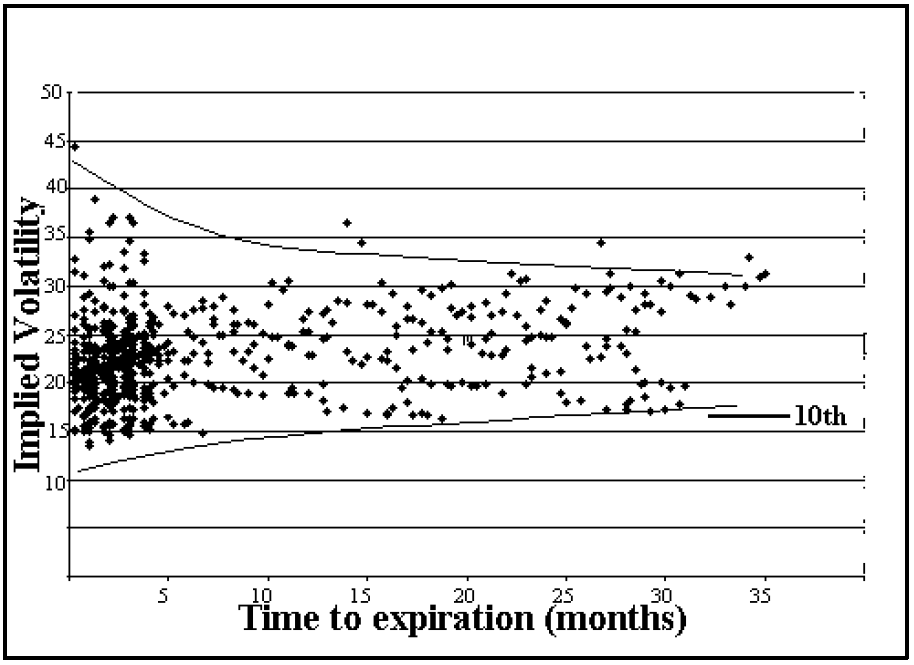
Volatility Ranges Over Time
Another facet of implied volatility that is often overlooked is how it ranges with respect to the time left in the option. This is particularly important for traders of LEAPS (longterm) options, for the range of implied volatility of a LEAPS option will not be as great as that of a short-term option.
In order to demonstrate this, we went back through five years of issues of The Option Strategist and pulled out the $OEX implied volatilities of at-the-money options for the various months existing at that time. The current table of such volatilities is on page 6 this week. We had over 600 different data points – plotting time to expiration vs. implied volatility. The resulting “scatter diagram” is shown above, in the center of the page 2.
I have drawn a couple of curved lines that contain most of the data points. You can see from these lines that the range of implied volatility for near-term options is greater than it is for longer-term options. For example, the implied volatility readings on the far left of the scatter diagram range from about 14% to nearly 40% (ignore the one outlying point). However, for longer term options of 24 months or more the range is about 17% to 32%. While $OEX options have their own idiosyncracies, this scatter diagram is fairly typical of what we would see for any stock or index option.
One conclusion that we can draw from this is that LEAPS option implied volatilities just don’t change nearly as much as those of short-term options. That can be an important piece of information for a LEAPS option trader – especially if he is comparing the LEAPS implied volatility with a composite implied volatility or with the historic volatility of the underlying.
We are occasionally asked by subscribers why we don’t buy LEAPS straddles, since we buy so many straddles as a matter of course. The easiest answer is that LEAPS options are rarely in the 10th percentile or lower of implied volatility.
Once again, consider the scatter diagram on the previous page. While it is difficult to discern from the graph alone, the 10th percentile of $OEX composite implied volatility – using all of the data points given – is 17%. The line that marks this level (the 10th percentile) is noted on the right side of the scatter diagram. It is quite easy to see that the LEAPS options rarely trade at that low volatility level. Hence, since one of our straddle buying criteria is that the options reside in the 10th percentile or lower of implied volatility, then it is unlikely that we’ll see many LEAPS options fulfilling that criterion.
You can see from the scatter diagram that the distance between the curved lines is much greater on the left side (i.e., for shorter-term options) than it is on the right side (longer-term options). Thus, it’s going to be hard for the longer-term options to register either an extremely high or extremely low implied volatility reading.
One might say that, if he were going to buy longterm straddles, he should only look at the size of the volatility range on the right side of the scatter diagram. Then, he could make his decision about whether the options are cheap or not by only comparing the current reading to past readings of long-term options. I think this is somewhat fallacious reasoning for a couple of reasons: first, if one holds the straddle for any long period of time, the volatility range will widen out and there is a chance that implied volatility could drop more than one envisions when he initially buys options that are in the 10th percentile; second, the long-term volatility range might be so small that – even though the options are initially cheap – an increase in implied volatility over several deciles might not translate into much a of gain in price.
Data
You might be wondering where you’d find the data necessary to make these decisions. At the current time, it’s not easy to come by, but here are some approaches. First, as a subscriber to The Option Strategist, you are availing yourself of the data via our recommendations. We pay attention to such things whenever we analyze volatility trades. Another approach is to view an implied volatility chart. The software product, Option Vue, has such charts. Also, we are in the process of working with two internet sites who are both interested in volatility trading. If these agreements work out, we will have volatility charts available online within a few months. Finally, you might consider our daily volatility extremes service (cost: $100/month), which not only shows the most expensive and cheapest composite implied volatilities each day, but also shows the range of those volatilities, so you would have some notion of the ‘volatility of the volatility.’
Summary
It’s important for anyone using implied volatility in his trading decisions to understand that the range of past implied volatilities is important and also to realize that the volatility range expands as time shrinks. From questions from traders and subscribers, I’ve come to realize that many people think they’re buying a cheap option when, in fact, they might not be. First, they are often comparing implied to historic volatility and second, they tend to ignore the ‘volatility of implied volatility’ – i.e., they do not know nor pay attention to the range in which implied volatility has traded in its history.
This article was originally published in The Option Strategist Newsletter Volume 9, No. 18 on September 28, 2000.

© 2023 The Option Strategist | McMillan Analysis Corporation