
By Lawrence G. McMillan
This article was originally published in The Option Strategist Newsletter Volume 7, No. 11 on June 11, 1998.
An option strategist is often faced with a difficult choice when it comes to selling (overpriced) options in a neutral manner -- i.e., “selling volatility”. Many traders don’t like to sell naked options – especially naked equity options – yet many forms of spreads designed to limit risk seem to force the strategist into a directional (bullish or bearish) strategy that he doesn’t really want.
In the past few months we have run two articles related to volatility trading – one on the methods for selling naked options (Vol. 7, No. 3), and another on straddle buying (Vol. 7, No. 9). Now, we will address the more daunting prospect of trying to sell volatility with protection in the equity and futures option markets.
Personally, I like selling naked options on indices. Indices can’t report bad earnings, can’t be taken over, and generally don’t display any of the annoyingly large trading gaps that are prominent in stock trading and – to a lesser extent – in futures trading. Therefore, while there is unlimited risk in selling naked index options, I feel that the best strategy for “volatility trading” on broadbased indices is to sell the options naked. However, that is certainly not the case with equity and futures options, where large trading gaps make it difficult to live with a completely naked option strategy. The quandary in trying to “sell volatility” in those option markets comes in trying to find a neutral strategy that allows one to benefit from the sale of expensive options without paying too much for a hedge – the offsetting purchase of equally-expensive options. The simple strategy that most traders first attempt is the credit spread. They sell a strangle, for example, and hedge it by buying a further out-of-the-money strangle. We will use Telebras (TBR) options throughout this article because 1) they are expensive, and 2) the stock is not a takeover candidate (although the company is going to subdivide – a fact which accounts for the increase in implied volatility).
Example: With Telebras at 115 and its options
trading in the 93rd percentile of implied volatility
(i.e., they are quite expensive), one might consider
selling the July 100 puts and the July 130 calls.
This strangle sale brings in about 4-1/2 points of
credit.
  However, since TBR stock can be quite
volatile, a hedge is needed. The simple approach
would be to hedge by buying another strangle –
perhaps the July 95 put and the July 135 call,
which are each 5 points (one strike price) further
out-of-the-money. That strangle, however, costs
just over 3 points, so most of the credit that was
originally captured is spent on the protection.
  All the options would expire worthless if
TBR were between 100 and 130 at July
expiration, so the position would produce its
maximum profitability in that range – about 1-1/2
points. Risk is limited to 3-1/2 points – if one of
the 5-point spreads has to be bought back for the
maximum 5 debit at expiration. The profit graph
is shown below.
  Theoretically, if implied volatility were to
fall during the time the position is in place, a
profit might be realized. However, after
commissions on four different options, in and out,
there probably wouldn’t be any real profit left if
the position were closed out early.
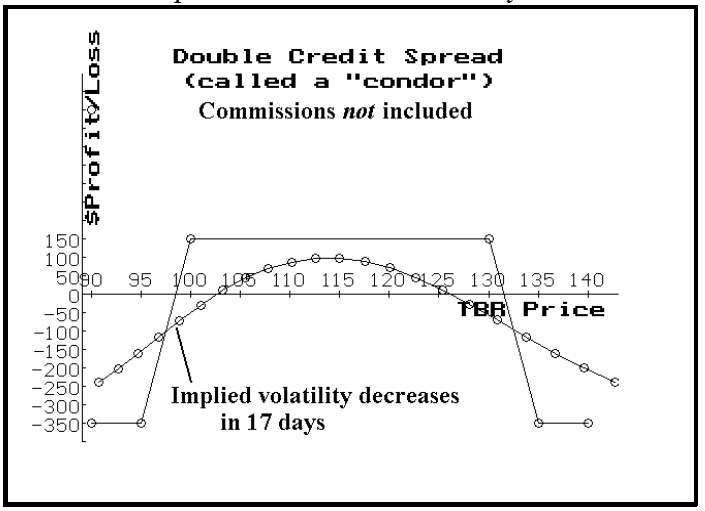
The probability of the stock being in the 100-130 range at expiration is not large (about 53%, according to our probability calculator). We could have used strike prices that were farther out-of-the-money and that would increase the probability of profit, but the net credit would have shrunk proportionately.
In sum, there is nothing wrong with this strategy, but it just doesn’t seem like anything to get too excited about. Yet, there is another approach that can often provide larger profit potential and still retain the potential to make money if implied volatility decreases.
This strategy is derived from the math surrounding the “greeks” of an option – delta, gamma, and vega, but it is not necessary for us to go into the grisly math details in order to explain and utilize the following version of the strategy. We will look at the strategy first, and then discuss things like margin later.
Consider the following prices for TBR options. For each option, four items are listed: the price of the option, the implied volatility of that individual option, and then below those, the delta of the option, and the vega of the option (the vega is the amount that the option will increase in value if implied volatility rises by one point).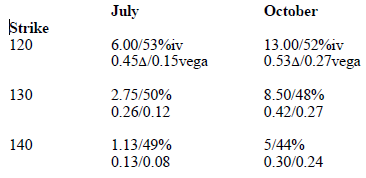
Since implied volatility is currently “too high”, what we would like to do is construct a delta neutral position that will make money if implied volatility decreases. Conceptually, the biggest premiums are available in the October options (and they have the biggest vegas, too – that is, if implied volatility drops, the October options will drop more in price than will the July’s).
The problem is that, if we sell October options and hedge them with the purchase of other October options, we are no better off than in the previous example. What would happen, though, if we chose to hedge the October options with the less expensive July options?
Here’s a possibility. Since the delta of the October 120 call is 0.53, and the delta of the July 130 call is 0.26, a 1-by-2 spread would be delta neutral:
Buy 2 TBR July 130 calls at 2-3/4 (delta long 0.52)
and sell 1 TBR Oct 120 call at 13 (delta short 0.53)
Net credit recieved: 7-1/2 points
Virtually Delta Neutral
This position has limited risk because it does not involve naked options. In fact, if TBR were to rally by a good distance, we could make large profits because we are long an extra call. Meanwhile, on the downside, if TBR falls heavily, all the options would lose most of their value and we would have a profit approximately equal to the initial credit received. The following profit graph shows how this position behaves: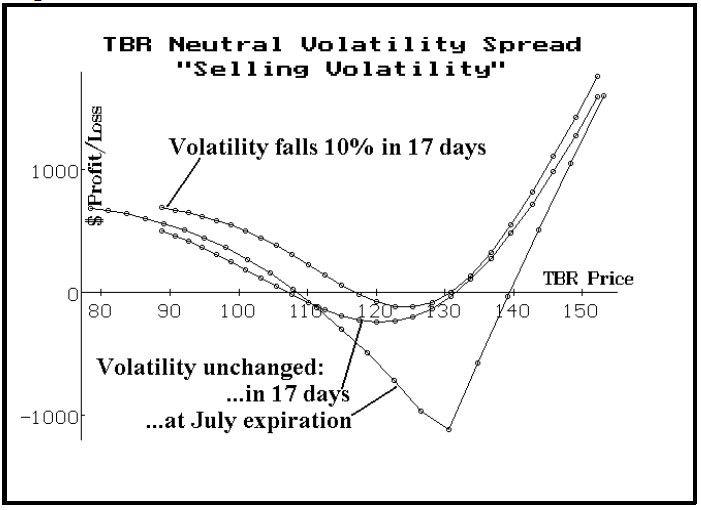
You can see that the position makes money on the upside and the downside and – true to our objective – a decrease in implied volatility over the next 17 days makes the profit graph even better. In fact, if that decrease in implied volatility did occur, the top profit curve shows that there is only a small area in which one would lose money. The biggest risk is that TBR is exactly at 130 at July expiration,
For those who like to see the actual math, you can compute the “vega” of this position and you will see that it is slightly negative – confirming that a decrease in implied volatility would be beneficial to the position. I’m going to inject a very little bit of math here, but skip forward if this bores you. To determine the actual ratio of options to use, one can construct two equations in two unknowns, using delta and vega, and solve for the quantities. For instance, in the above example, suppose that we had an objective of making $100 for each point that implied volatility decreased. Then these two equations would tell us how many of the July 120's to trade (variable x) and how many of the October 130's (variable y):
  0.26x + 0.53 y = 0 (equation for delta neutral)
    (0.26 & 0.53 are the deltas)
  0.12x + 0.27 y = --1 (equation to make 1 point,
    or $100, if volatility falls)
    (0.12 & 0.27 are the vegas)
  Solving, we get x = 80.3 and y = –39.4
This is essentially in line with our 2-by-1 example above, but it requires larger quantities to make the desired amount of money if vega drops instantaneously.
You can test other combinations if you wish by using some of the other options from the last table on page 2, but in each case, if you wish to have a negative vega (that is if you wish to make money if implied volatility decreases), you will find that it is necessary to sell October options and buy July options. In some cases, the “math” will tell you to be naked some options. I would reject those cases for equity and futures options for the reasons stated earlier – too many trading gaps can occur in the prices of equity and futures underlying instruments.
Modifications To The Strategy
Other modifications can be considered. One is to sell even longer-term options and of course hedge them with the purchase of the near-term options. The longer-term the option is, the bigger its vega will be – so a decrease in implied volatility will cause the heftier-priced long-term option to decline more in price.
This concept is somewhat tempered, though, by the fact that when options get really expensive there is often a tendency for the near-term options to be skewed – that is, the near-term options will be trading with a higher implied volatility than will the longer-term options. This is especially true for LEAPS options. For that reason, one should make sure that he is not giving up too much via a possible implied volatility skew.
In the previous example, the implied volatility of the TBR Oct 120 call being sold was 52% and that of the July 130 calls being bought was 50% – so they were nearly the same (even favoring the spread in the way that it was implemented). However, in other cases you may find that the longer-term option has a much lower implied volatility than the one you were going to buy. If that is the case, I would recommend against entering the trade with those options. As a corollary, then, it is unlikely that this strategy will work well with LEAPS options.
One other thing that you should analyze when looking for this type of trade is whether it might be better to use the puts than the calls. For one thing, you can establish a position where the heavy profitability is on the down side (as opposed to the upside, ala the TBR example above). Then, of course, having considered that – it might actually behoove one to establish both the call spread and the put spread. If you do both, though, you create a “good news, bad news” situation. The good news is that you reduce your maximum risk – for example, if TBR goes exactly to 130 (the worst point for your call spread), your put spread’s credit would reduce that risk a little. However, the bad news is that you have a much wider range over which you don’t profit since you then have two spots where losses are more or less maximized (at the strike price of the long calls and again at the strike price of the long puts).
Margin Considerations
Now, we come to a very important topic: margin. As you can see from the profit graph on the left, this is a completely a hedged position up until July expiration. Even a novice option trader could tell this, because there are no naked options in the position – the shorts are more than covered by the longs. Unfortunately, the Fed must have less knowledge of this than “even a novice option trader”, because – for equity options – the October options are considered to be uncovered!
This means that one has to margin the position as if these were naked options – at 20% of the stock price, plus the premium, less any out-of-the-money amount. So, with TBR at 115, the idiotic Reg T requirement for selling one Oct 120 call in this spread would be (20 x $115) + $1300 (the premium) - $500 (the out-of-the-money amount) = $3100. This can be reduced by the net credit received ($750 in this case), bringing the requirement down to $2350. Unfortunately, if TBR rises in price, the margin requirement rises too. As you can see from the profit graph, we would be ecstatic if TBR went flying to the upside – we could be making some big money. However, your friendly margin clerk would be calling you daily, asking for more margin. Is that ridiculous or what?
Even with this margin “problem”, this is an attractive strategy – especially if you have T-Bills in your account that can act as collateral margin for the trade. So we are going to make an “official” recommendation. These strikes are different from those in the example since TBR has changed in price between the time that we wrote the example and the time we are going to press.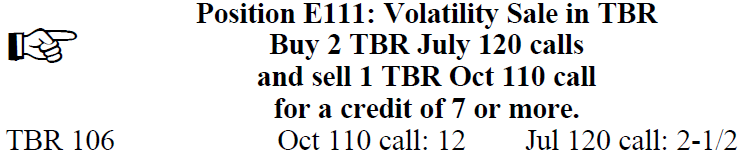
If TBR is substantially different in price by the time you are ready to enter the order yourself, you may once again have to adjust the strikes – but you see that we are essentially buying calls 15 points out-of-the-money and selling calls 5 points out-ofthe- money.
Futures Options-No Problem
The margin anomaly is not a problem with futures options, however. For those options, one need only margin the difference in the strikes – less any credit received – for that is the true risk of the position. The Silver spread that we established last issue, Position F177, is a volatility sale of the type described above for TBR. So, in that sense, this type of volatility sale strategy may be attractive, too. See page 8 for a similar futures strategy that is attractive now.
In summary, the volatility trader who wants to sell volatility in the equity and futures options market needs to be hedged. This strategy creates a more neutral, less price dependent way to benefit if implied volatility decreases -- especially when compared with simple credit spreads.
This article was originally published in The Option Strategist Newsletter Volume 7, No. 11 on June 11, 1998.

© 2023 The Option Strategist | McMillan Analysis Corporation