
By Lawrence G. McMillan
This article was originally published in The Option Strategist Newsletter Volume 14, No. 7 on April 15, 2005.
An “iron condor” (also sometimes simply called a “condor”) is the name applied to a rather basic strategy that has many adherents. In this article, we’ll define the strategy and give examples, but we also want to look at a possible way to improve upon the strategy by using a new product – $VIX options – which should begin trading soon.
The iron condor strategy is a fairly simple one – the sale of credit spreads both above and below the current (index) market price. Risk and reward are both limited, but rewards are more probable than the risks, assuming that all options are out of the money initially. Specifically, four striking prices are generally used, and thus the spread requires the payment of four commissions – making the strategy viable only for accounts with low commission costs.
  Example: $SPX: 1190
     An iron condor would be:
     Short May 1240 call, Long May 1250 call
     Short May 1050 put, Long May 1040 put
     – all in equal quantities
Note that the options being bought are farther out-of-the-money than the options being sold, so that both the call spread and the put spread are credit spreads. In this example, the puts are farther out of the money than the calls, so that the option prices are more or less equal At currentt prices, this might be the trade:
    $SPX: 1190
    Buy 1 May 1250 call: 0.50
    Sell 1 May 1240 call: 1.00
    Sell 1 May 1050 put: 1.00
    Buy 1 May 1040 put: 0.50
    Net credit: 1.00 point, less commissions
The desire is that $SPX is somewhere between the short option strikes – between 1050 and 1240 – at expiration, so that all the options expire worthless and thus one profits by the amount of the initial credit in the position (1.00 point).
Due to changes in the exchange minimum margin requirements a couple of years ago, it is only necessary to margin one side of this spread. In the above example, then, the margin required would be 10 points (the difference in the strikes), less the credit received. Technically, the margin required is that of the put spread or the call spread, whichever is greater. But when the differential in the striking prices is the same – 10 points on both the call spread and the put spread in the above example – then the margin requirements are equal for both spreads. In theory, one could, say, establish a put credit spread with 20 points difference in the strikes and a call credit spread with 10 points between the strikes, and then the margin would be 20 points – the greater of the put and call spreads.
Risk/Reward
The maximum profit potential of the iron condor is the initial credit received. However, the risk is much greater than that. In fact, if the underlying moved far enough, one would be forced to pay as much as the difference in the strikes to close down the position.
Using the above example, suppose that $SPX fell to 1000 by May expiration. The calls would all expire worthless, but both the May 1040 and the May 1050 puts would be in-the-money, and the position would be closed via automatic exercise. The May 1040 put would be worth 40 with the underlying at 1000 at expiration, while the May 1050 put would be worth 50. Hence, to close out the spread would incur a debit of 10 points – the difference in the strikes. Since the initial credit was 1.00 point, that means the potential risk on the trade is 9.00 points.
Figure 1 shows the profit graph of this trade. The breakeven points – 1049 and 1241 – are marked on the chart. These breakeven points are:
Upside breakeven: short call strike + credit rcvd
Downside B/E: short put strike – credit rcvd
So, with an iron condor strategy you are laying big odds – 9 to 1 in this example – but the probability of success is what’s important.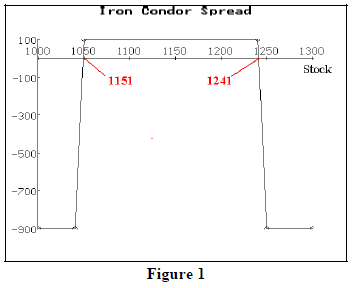
One can calculate the statistical probabilities with our Probability Calculator 2000. One would probably want to adjust the strikes, based on the volatility of the market. That is, in a low-volatility market, such as the current one, one might choose strikes that are about 50 points out of the money for the written options in the spread. If one establishes the condor with options that have one month of life remaining (recommended), then the probability of $SPX moving 50 points in one month is fairly low. However, back in 2002, when $VIX was near its alltime high and the market was very volatile (the Dow moved 300 or 400 points in a day several times), it would have been necessary to use a much wider separation of the short options from the initial index price (one could still have used 10 points difference in the strikes to limit risk). So with $SPX near 1100 at that time, he might have sold the 1200 strike and sold the 1000 strike as the “inside” strikes in the condor – allowing twice the distance as he would allow in a low-volatility environment.
Applying Statistics
Rather than guess at these things, one should use statistical analysis to help him gauge the risk of the spread. For example, one might want to sell options that are two standard deviations out of the money, and then hedge them by buying options that are another 10 points out-of-themoney. The probability of the underlying closing more than two standard deviations away from its initial price is about 5% (either up or down), so that means you’d have a 95% chance of the options expiring worthless. That might be too conservative for some, but it is a starting point, at least. A more aggressive stance might be something like this: sell options that are one standard deviation out of the money and hedge them with options that are five points further out-of-the-money. You’d be taking more risk by selling the options that are more likely to get “in trouble,” but you’d be limiting your risk by tightening the striking price differential in each credit spread.
It should be noted that, if one uses this statistical approach – selling the options at a fixed number of standard deviations away from the current underlying price – the call strike will be farther out-of-the-money than the put strike, as long as one assumes the distribution of prices is lognormal – which our calculator does (as do most others). The really nice thing about using the statistical approach is that you don’t have to guess how much to adjust for volatility – it is part of the formula. The simple formula is given here:
     Higher strike = index x e^(sdev x $VIX x sqrt(t))
     Lower strike = index x e^(-sdev x $VIX x sqrt(t))
where
     index = initial underlying index price
     sdev = number of standard deviations you want to
          allow for movement (< 3.0)
     $VIX is the volatility estimate (as good as any, if
          you’re using $SPX options)
     t is time to expiration, in years
Example: $SPX = 1200; $VIX = 0.14, t = .083, sdev = 2
     Higher strike = 1301.02 (which you would
          implement as 1300)
Avoid Early Assignment
One should be certain to use either futures options or European style options in this strategy in order to avoid the problems of early exercise. You might think that early exercise wouldn’t be a consideration, but it could be. Consider this scenario.
 Example: you decide to use the condor strategy,
 but you use $OEX options, which are Americanstyle
 options – meaning that they can be exercised
 (and thus assigned) at any time during their life.
 The initial trade was as follows:
      $OEX: 560
      Buy one $OEX May 605 call
      Sell one $OEX May 600 call
      Sell one $OEX May 530 put
      Buy one $OEX May 525 put
 Later, $OEX plunges to 500, and the puts are
 trading at parity. One morning, you arrive at
 work to find that you have been assigned on your
 short May 530 puts (and charged a $3000 – 30
 point – debit to close out the option). You are
 now long the May 525 puts, which are worth 25.
 But before the market opens, bullish news hits the
 tape and the market gaps higher. Your May 525
 puts open at a price of 21. If you sell them there,
 you would have unwound your 5-point credit
 spread for a 9-point debit! You paid 30 to buy
 back the May 530 put (via assignment) and only
 got 21 for the May 525 put because the market
 moved.
While the above scenario is not likely to happen often, it could happen, and thus is reason enough to stick with European style index options or futures index options to avoid the problem. In theory, stock options could be used for the condor strategy, but stocks don’t usually offer the array of strike prices that are necessary to run the strategy optimally. Besides, early assignment becomes a problem with stock options too – not for the same reasons as for $OEX options, but there are dividend considerations and extra commission costs if assigned.
How Profitable Is This Strategy?
At first glance it might seem like there isn’t a lot of profit potential in this strategy because the credits generated are only fractional. To a certain extent that’s true, but over time the credits build up, and the investment is small. We ran a simulation, going back to 1993, and determined these results.
Using two standard deviations to set the strikes, and using a 5-point credit spread for both the puts and the calls, the cumulative net profit over twelve years was $2200 on an investment of $500. That’s a compounded annual return of about 13%. With this strategy, there were only two losing months in twelve years. The maximum loss was incurred in September, 2001, and a smaller loss was incurred in June, 2002.
This backtest assumed that no adjustments were made – even if the underlying index fell below the strike of the short put or rose above the strike of the short call. One might think he could make some adjustments in those cases to improve results, but be careful if you’re thinking of doing that because a mistake could wipe out a lot of months of profits (which are quite fractional).
A Hedge With $VIX Options or Futures
In closing, let’s address a modification of the strategy. Returns appear to be larger if one sells options that are only one standard deviation out of the money. However, losses are more frequent, as you might expect. Furthermore, the maximum loss can be encountered more often than one might like. The losses generally come after one sells the condor and then sees $SPX behave with a volatility far in excess of the $VIX prediction that was used for the striking price estimate.
Ironically, big down months in volatile markets (September 1998, July 2002 and October 2002, for example) were not losers because the $VIX estimate was sufficiently large that the short strikes were very far away. However, June 2001 and August 1998 were losers because the first bad drop in prices came from a low $VIX reading.
So if one were to buy $VIX futures – or preferably, $VIX options (after they start trading) – when $VIX is low, in conjunction with the condor spread strategy, he might be able to improve results. The hedge wouldn’t be necessary once $VIX was already high in value, but could be useful when it’s low and has the potential to explode.
This article was originally published in The Option Strategist Newsletter Volume 14, No. 7 on April 15, 2005.

© 2023 The Option Strategist | McMillan Analysis Corporation