
By Lawrence G. McMillan
This article was originally published in The Option Strategist Newsletter Volume 18, No. 12 on June 25, 2009.
Recently, the CBOE’s Volatility Index ($VIX) has been trading at substantially higher levels than the 20-day historical volatility of the S&P 500 Index ($SPX). While it’s somewhat normal for $VIX to trade higher than historical volatility, the recent differential (over 10 points on some days) has been large enough to raise eyebrows among those who follow these things – e.g., us! In this article, we’ll examine the relationship between $VIX (implied volatility of $SPX options) and historical volatility of the $SPX Index itself.
We’ll also factor in the relationship between $VIX and its futures contracts (premium or discount). We’ll see whether these relationships have the ability to predict the movements in $SPX or at least to predict volatility changes in $SPX.
Let’s start by examining the relationship between $VIX and the historical volatility (also called statistical, or actual, volatility) of $SPX. $VIX is designed to be a 30-(calendar)day estimate of implied volatility. It is often compared to the 20-(trading)day historical volatility, when one compares it to actual volatility. Technically there are about 22 trading days in 30 calendar days, but round numbers are generally used, just to make things a bit easier to understand.
In general, $VIX trades at a higher price than actual volatility most of the time. This is a phenomenon that we first wrote about many years ago when we were discussing $OEX options1. Figure 1 shows the raw data for a) $VIX and b) the 20-day historical volatility of $SPX, and then c) shows the difference as the lower line on the graph.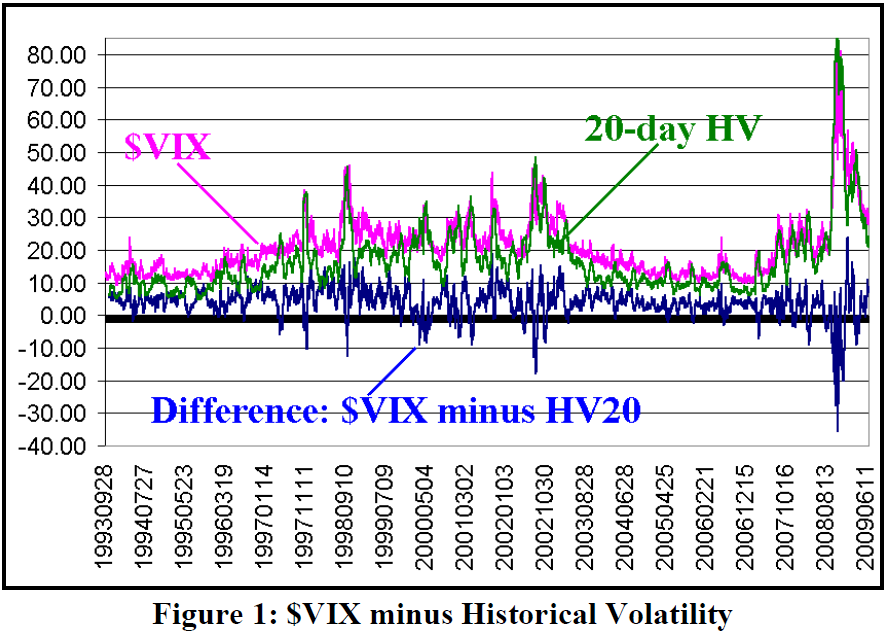
Observe that lower line: you can see that it is above zero most of the time. That is, $VIX is higher than the 20-day historical vol. Sometimes this difference widens to more than 10 points, but most of the time it is less than that. In times of great crisis, this relationship inverts (most notably at the 2002 bear market bottom and during the “crash” of 2008).
Figure 2 shows the actual distribution (using daily closing data) over this 16-year period ($VIX was introduced in 1993, which is why we have taken the data back to that year). That is, the data points that comprise the blue line in Figure 1 are plotted as the bar graph in Figure 2. There are over 3,900 data points in this study, so “percent” on the Y-axis in Figure 2 refers to what percentage of those 3,900 points fell into each one-point spread of daily differentials.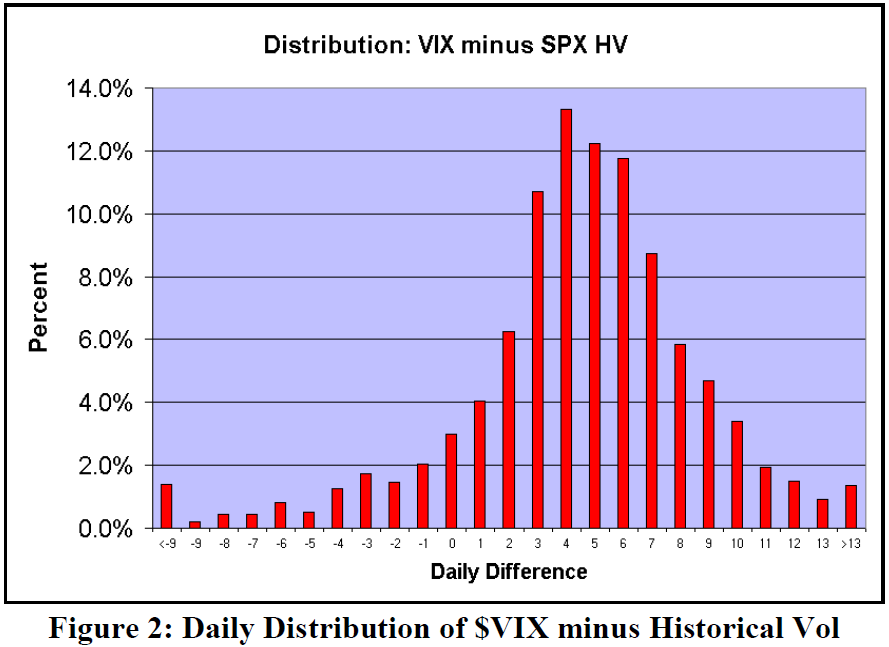
Most frequently, $VIX closes 4 points higher than historical volatility on any given day. There is also great frequency at closes across the spectrum from +3 points to +7 points. 57% of the daily closes fell into that range.
Negative differentials – that is, days when $VIX closed below historical volatility – were relatively rare: only 10% of the time was that the case.
In general, the distribution in Figure 2 is quite similar to the standard Bell Curve, although it is not exact. This is what one would expect, of course, but it’s interesting to see that in fact, it does conform to expectations. Two-thirds of the data points fall between +2 and +9 on the distribution chart.
We arbitrarily cut off the distribution at +13 and –9. Only about 2.5% of all data points fell outside of that range, but those might be the most significant data points in terms of predicting $SPX prices or volatility. Let’s examine those a bit further.
The Differential Regarding Forthcoming Volatility
There were 35 different times in history when the differential between $VIX and historical volatility reached positive double digits (+10 or more). Some of these times were only for a day or two, while others were for much longer periods of time. The longest two periods were 32 days – in each of October, 2001, and February, 2003.
It is interesting to note that both of these periods were near bullish market moves. The 2001 spate of high differentials came while the market was rallying after the debacle of the terrorist attacks on 9/11/2001. The 2003 period of high differentials came just before the bottom of that bear market was reached, and a strong rally occurred in March, 2003.
From a broad perspective, when the differential is greater than +10, something has to give. Either $VIX has to decline, or historical volatility has to increase, or both – to get the differential back down to the “normal” four points or so.
In fact, of the 35 times that the differential was +10 or more, historical volatility rose in the aftermath a rather astounding 31 times! In some of those cases, $VIX also rose – just not as fast as historical volatility did. So, we can state with a fair degree of certainty that, when the differential is 10 points or more, it is a harbinger of a more volatile market to come.
There is far less data when $VIX is substantially lower than historical volatility. In fact, only seven times (in 13 years) has the differential been –10 or lower. In 5 of those 7 cases, historical volatility fell afterward. This confirms – over a much smaller sample – that large differentials are followed by an adjustment in historical volatility, rather than $VIX. In other words, $VIX is “correct” and historical volatility adjusts to it.
The Differential Regarding Forthcoming $SPX Prices
These extreme, double-digit differentials are good predictors of forthcoming volatility, but are not as good at predicting actual market movements. Of the aforementioned 35 times that the differential was +10 or more, subsequent $SPX movements were:
Lower: 10 times
Unchanged: 10 times
Higher: 15 times
That is about as inconclusive as it can be. Furthermore, note that sometimes $SPX was relatively unchanged over the near term, even though we know from the previous data that actual volatility was increasing! This once again shows the vagaries of the volatility calculation: a lot of updown- up action can raise volatility without necessarily raising or lowering the price of the index significantly.
It is logical, at this point, to bring in another piece of data – that of the $VIX futures. Admittedly, we only have data going back to 2006 (and some of that data is almost useless, back when $VIX was so low – below 14, say – that the futures premium was useless as an indicator).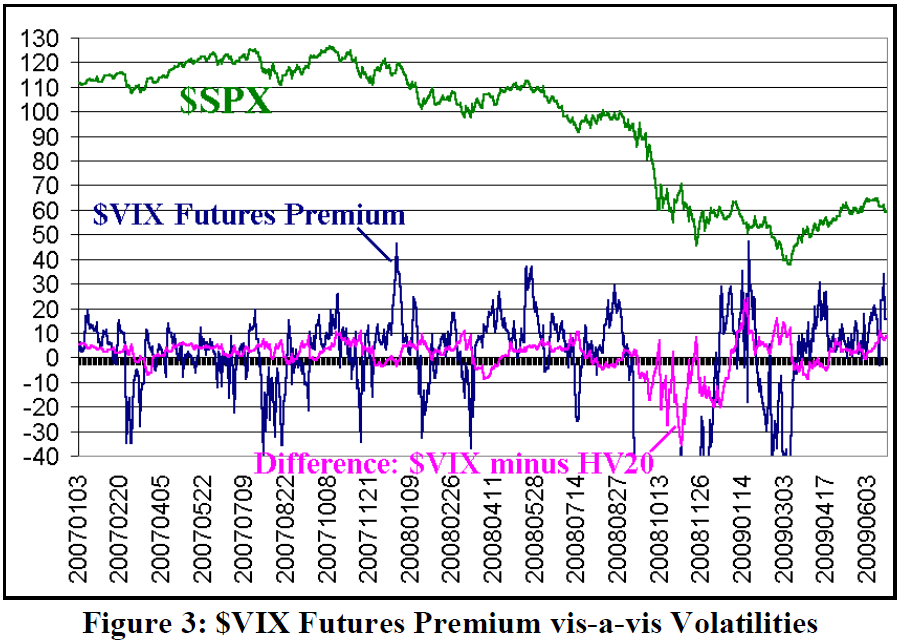
Figure 3 above compares $VIX futures premium (blue line) with the same difference in volatilities (pink line), with an $SPX price chart overlaid above. Note that this is over a much shorter time frame than the earlier Figures 1 and 2.
There is not necessarily a lot of correlation between $VIX futures premiums and the difference in volatilities, although there is some. Both were low in October, 2008, and both were high in November, 2008. But they were opposing in March, 2009, for example. This is not surprising. Recall that the volatility differential is more of a predictor of a forthcoming volatile market move than it is of market direction, while we view futures premium as a predictor of market direction. So, we wouldn’t expect the two to align, except at random times.
The $VIX futures are “forward-looking” (perhaps even more so than $VIX, since as we know, $VIX often moves to meet the futures price). So perhaps rather than looking at the differential between $VIX and historic volatility, perhaps we should be looking at the differential between the blended front-month futures price and historic volatility. This might give us a more accurate picture of when the volatility differentials are really out of line.
This concept is particularly interesting at the current time, because we recently had the following construct:
Date: June 17, 2009, closing prices
$VIX blended front month futures: 33.86
$VIX: 31.54
20-day historical $SPX volatility: 21.57
Here, not only is $VIX nearly 10 points above historical vol, but the $VIX futures are 2.32 points higher than $VIX. That means the differential between forward-looking vol (the futures) and historical vol is a whopping 12.29 percentage points.
While June 17th was the peak day, this differential between futures and historical vol has been hovering at double-digit figures for the last week.
Figure 4 shows this differential between the price of the blended front-month futures and historical volatility, overlaid with an SPX chart. There have been five previous times (in the last two years) that blended front-month futures differed from historical vol by more than 10 percentage points.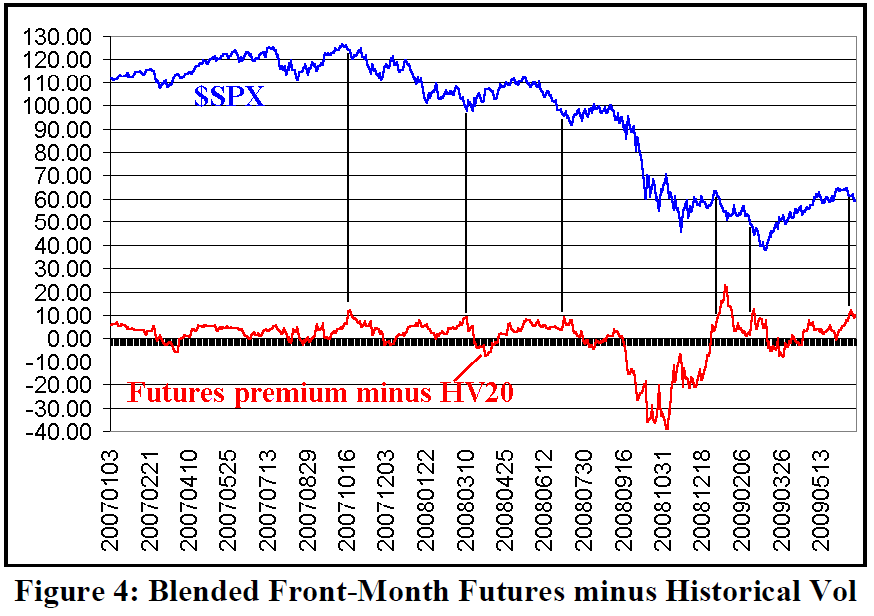
The thought occurs that perhaps futures premium might sometimes give market direction signals at the same time that the volatility differential is signaling an increase in volatility is about to occur. In these cases, one might be able to use the concurrent signals as an opportunity to take a (larger) directional market position.
Black vertical lines have been drawn on the chart in Figure 4, at the beginning of the “above +10" differential period. You can see that each one was close to the beginning of a volatile market move. Ironically, even though this was during a bear market, two of the five signals preceded bear market rallies.
How did the futures premium itself do as a predictor in those five instances? In the interest of saving space, we are not reproducing the scatter diagram of front-month futures prices. However, it was on Page 9 in each of the last two issues of this newsletter, so you may want to refer to it there. In fact, the first four signals marked on the above chart were “called” correctly by $VIX futures premium signals. Only the last signal (in February, 2009, halfway down through that move into the March bottom) was not confirmed by futures premium (at that time, discounts had already begun to appear in the $VIX futures).
So, this is an impressive track record, although one must consider that the data is rather limited.
Another Viewpoint
One might wonder why we used absolute differential in percentage points between $VIX/$VIX futures and the historic volatility. The alternative would be to use percentage differentials. While this is somewhat appealing on the surface, in actual practice, this type of data was far too volatile to analyze. For example, at the current time, $VIX is roughly 32 and historic vol is 22. That’s a ratio of 1.45, or $VIX is 45% higher than historic volatility. Obviously, that is significant at current levels. However, when historic volatility was below 10 – which it was for much of the time in recent years – that ratio was easily attained. For example, if historical vol is 10, $VIX need only be 14.50 or higher in order for it to be trading at a 45% premium to $VIX.
Figure 5 below shows the percentage diagram of $VIX divided by historic vol (similar to Figure 1). Notice how “noisy” Figure 5 is – to the point that the data would have to be further constrained before it would even be useable to all.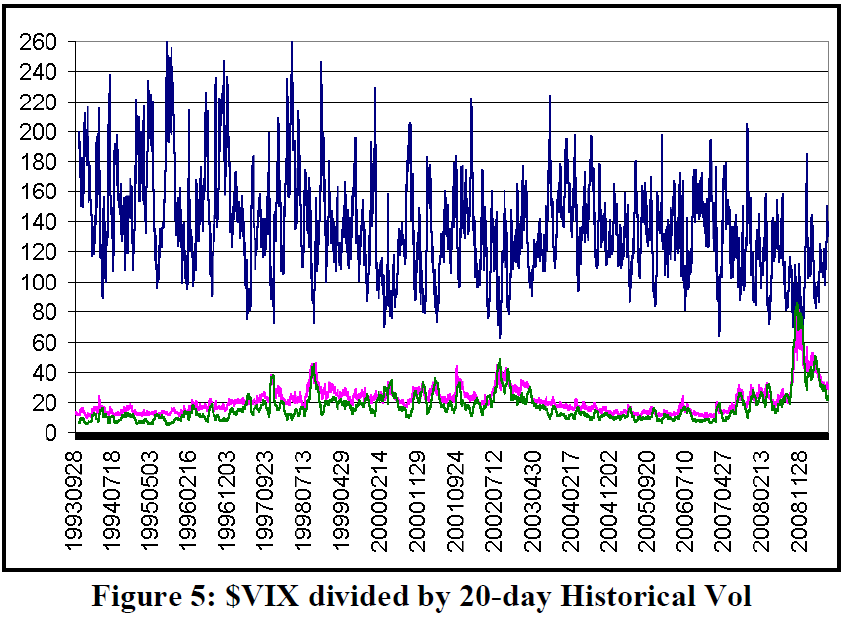
The Current Situation
We currently sit on the cusp of the sixth signal, using the difference in $VIX futures price and historical volatility (far right-hand side of Figure 4). At this time the $VIX futures are trading with a large premium. That, of course, is a sell signal for $SPX. Couple that with the information that we have presented above, where we expect that actual volatility is about to expand, and one has a budding major sell signal.
Summary
We sifted through a lot of data in this article, but the most important point to take away is that when implied volatility differs substantially from actual volatility, it is likely that actual volatility will move to meet implied (as opposed to the reverse). Moreover, it is much more common for $VIX to be higher than actual vol, and when the differential grows large, a volatile stock market is to be expected. Finally, the differential should probably be calculated as that between the price of the blended frontmonth $VIX futures and historical volatility, rather than $VIX and historical vol. This gives a truer representation of implied volatility expectations.
This article was originally published in The Option Strategist Newsletter Volume 18, No. 12 on June 25, 2009.

© 2023 The Option Strategist | McMillan Analysis Corporation