
By Lawrence G. McMillan
This article was originally published in The Option Strategist Newsletter Volume 21, No. 20 on October 26, 2012.
I’m always a bit dubious of analyses of how a particular indicator or market behaves in an election year. First of all, you have to throw out 75% of your results, which automatically reduces the reliability of the data. However, there are some patterns that seem to be significant, so let’s look at some of these.
October Seasonal in Election Years
If one takes Table 1 (on page 2) and extracts only the Presidential election years, he is left with the following:
Table 4: Presidential Election Years Only

   Year   $SPX   Entry    Pct
   1980   1.16   127.80   0.9%
   1984   2.13   165.20   1.3%
   1988   1.78   277.20   0.6%
   1992   4.26   418.49   1.0%
   1996   5.81   700.92   0.8%
   2000   48.74  1379.58  3.5%
   2004   5.16   1125.40  0.5%
   2008   117.38  848.92 13.8%

    Sum  186.42 22.5%
Average   23.30 2.8%
Because 2008 is included in this data, the results are superior to the overall results shown previously. Every year produced a gain. The average gain is 23.30 $SPX points (+2.8% on average), as compared to the overall results of an average gain of 11.34 $SPX points (+2.0% on average). Of course, if one throws out 2008, the average gain is only +1.2% – below the average. See the problems with using a data set that is only 25% of the full data set?
In any case, there are no screaming signs here warning us to stay away from the October Seasonal during Presidential election years, so we plan to continue with the afore-mentioned SPY call buy recommendation at Friday’s close.
$SPX In Election Years
We have $SPX data going back to 1950, so it wasn’t too difficult to construct Table 5, which shows the result of the market (as measured by $SPX) each election year, from the last trading day in September through the day prior to Election Day. It should be noted that the stock market was closed on Election Day until 1984 – a rare bit of trivia probably not known by most younger traders.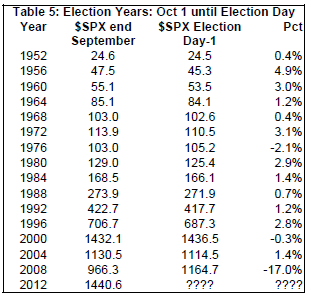
Usually, October is a positive month, prior to election day. However, the big bear market of 2008 was the one major exception. There were much smaller losses in 1976 and 2000 – both bear market years of their own (although 2000 was far worse of a year overall than 1976).
This year, through October 25th, $SPX is down 3.6% (from 1461.4 on October 4th). If this negative return on $SPX holds up this year (and it might not, because of the October Seasonal buy signal), that would make three of the last four election years in the losing column. Is this a change of trend or just an aberration? Rhetorical question. Do we really care?
$VIX Seasonality in Election Years
We occasionally publish charts showing the seasonal pattern of $VIX. Figure 2 below shows the composite price of $VIX for a 23-year history (1989 through 2011). This chart is constructed simply by following this method: gather the 23 $VIX prices for the first trading day of the year, sum them, divide by 23, and that is the first point to plot on the left of the graph. Continue that way throughout the year.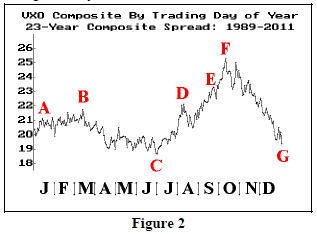
It is not too surprising to note that volatility bottoms out on July 1. The remainder of the year may be a bit surprising, though: first, volatility begins to climb right away during July and August, eventually peaking in mid- October. Then it falls dramatically during the fall of the year, eventually ending the year not much above the July lows. Of course, any one year can deviate from this pattern, but over the 23-year history, this is the “average” movement of $VXO (the “old” VIX) during the year.
In election years, the composite picture of volatility changes a bit, but not tremendously. Of course, now we only have 7 years (including this year) of data to work with. Now, the vol low is about September 1st, and volatility remains high longer — into Thanksgiving – before finally declining somewhat in December.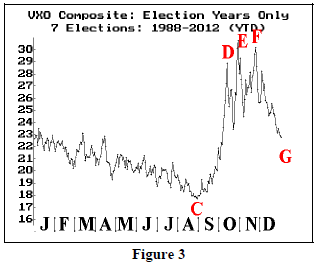
This article was originally published in The Option Strategist Newsletter Volume 21, No. 20 on October 26, 2012.

© 2023 The Option Strategist | McMillan Analysis Corporation