
By Lawrence G. McMillan
This article was originally published in The Option Strategist Newsletter Volume 12, No. 23 on December 11, 2003.
Probably too many traders treat options as pure speculation rather than the theoretically more profitable treatment as a hedging vehicle or as a way to take advantage of pricing discrepancies. Many of our articles deal with hedging or volatility trading (which is the generic term describing theoretical value trading), but in this article we’re going to change gears a little and talk about speculation – plain old vanilla option buying. Specifically, we’re going to talk about how option activity might denote a potential trade in a stock or its options, and then we’ll discuss how to follow up on the position – setting stops, and letting profits run if they develop.
Option Activity As An “Alert”
It has long been known that when illegal insider information is garnered by some people, they will ignore the law and trade highly leveraged instruments in order to try to profit from the news they know. They often use the option market for these purposes. While it is completely illegal to act on material information that is not public, it is perfectly legal for us – as technicians – to follow along where we see heavy option activity.
Such activity may predict takeovers, earnings surprises, earnings warnings, or any number of other corporate news events. Moreover, it is also useful for momentum trading (its main application in recent years, since takeover activity has diminished).
How can one spot such situations? First, look at today’s option volume as compared to average option volume for that particular stock. If today’s volume is at least twice the average volume and if there were at least 1000 total contracts traded, then you might have something worth investigating. If the heavy volume is mostly in call options then, take a bullish position – buy the stock or buy some calls. However, if the heavy volume is mostly in put options, then take a bearish position (which normally would mean “buy some puts”). Later, we’ll discuss which option to buy.
Note that using option volume in this manner is using it as a direct indicator, not as a contrary indicator. In other words, we are trying to go with the smart money in cases such as these – not trying to take a position opposite to the uninformed public opinion, as we might do in a broader sense when we look at put-call ratios, for example.
Of course, one needs to be mindful of the fact that many things can cause a sudden increase in option volume, and many of them are boring – not related to corporate news events at all. These would include arbitrage, hedging (say, buying puts to protect a long stock position), or even perhaps just a large covered call write by an institution. So, one who is looking at these situations must weed out this “noise” – meaningless volume.
One clue that might help find “true” speculative situations is an increase in implied volatility of the options. That is, if the traders with the (illegal) inside knowledge are not only buying plenty of options, but are willing to pay up for them as well, then you might have a higher probability of having found a tradeable situation.
Technical analysis is also a help. If these traders are buying call options, then the stock should be moving up. In fact, it should probably be breaking through resistance levels – or at least should have the potential to. If the stock is weak, then perhaps this is not a good situation to get into, despite what appears to be heavy call option activity.
It was mentioned earlier that momentum trading is another activity that can be spotted by heavy option activity. Momentum trading is defined as “buy high, sell higher.” Generally, what is happening in such situations is that a hedge fund (or other aggressive large trading institution) has a long position and wants to push the stock up so the position can be sold. They might “advertise” the stock by creating option activity, buying in a sloppy manner, and so forth, so that other traders might notice. Then, when the other traders come in to buy the stock – which appears to acting very well – the hedge fund will sell into them. This momentum can carry for quite a ways, though – long after the original hedge fund has exited – if enough people pile into the stock and if certain positive technical patterns develop.
The strategy can be used for short selling as well: the institution has a short position, then it buys puts or otherwise “advertises” a negative trading pattern for the stock, which then draws in other short sellers – thereby creating downside momentum.
Up-Down Volume
One very important confirming indicator in this regard is Up-Down Volume – the indicator invented by William O’Neill. Up-Down Volume is similar to “on-balance volume,” but is computed over a shorter time frame. Here is how the indicator is computed: look at the most recent 50 days of trading activity in the stock. On any day that the stock closed up, add that day’s volume to a running sum of “up volume.” Conversely, on any day that the stock closed down, add that day’s volume to a running sum of “down volume.” At the end of 50 days, divide the two:
Up-Down Volume = Sum of “up volume”/Sum of “down volume”
The ratio, of course, is always a number greater than or equal to 0. If the ratio is greater than 3.0, that is excellent volume; greater than 2.0 is very good; 1.0 is neutral, of course; less than 0.8 is poor; and less than 0.5 is terrible.
This ratio attempts to measure whether stock traders (in particular, large stock traders) are participating with good buying volume on days that the stock is up (which is what you want to see, if you’re bullish). Also, it measures whether traders are selling heavily on days when the stock is down – a bearish indication.
What we’d like to see if we are thinking of a bullish position – after having observed heavy call option activity – is up-down volume of 2.0 or higher. That is an excellent confirming indicator. On the other hand, if we see heavy put volume activity, then we are looking to take a bearish position in the stock, and thus we’d want to see up-down volume at 0.8 or lower.
Up-Down Volume is a very valid indicator in many trading situations. It will generally work best as confirmation in a situation where you are looking to trade a stock that already has an established technical pattern. For example, if the stock is trending up, then up-down volume can help tell you whether or not the upward momentum is strong. Conversely, if you are looking to short a stock (or buy puts), then you’d want to see poor up-down volume.
The indicator is useful in other contexts as well. For example, in covered call writing accounts, we generally want to see reasonably good up-down volume before we buy a stock and sell calls against it. In those situations, we aren’t even necessarily looking for positive stock technical patterns – we just want to avoid negative ones.
The indicator doesn’t work as well when you are going against the tide, however. For example, in many of our put-call ratio recommendations, we are looking to buy a beaten-down stock after it has stabilized and perhaps made its first higher high in what we hope will be a series of new highs. Such a “beaten-down” stock will likely not have positive up-down volume patterns. Mind you, we don’t buy stocks in steep downtrends – put-call ratio buy signals or not – but even after the downtrend ends, you won’t find the up-down volume indicator giving a positive reading right away.
What Option Should One Buy?
In these situations, which are likely to be short-term in nature, we prefer to buy a short-term, in-the-money option for it behaves much like stock itself. Thus, if the underlying stock makes a small move of a point or two in our favor, such an option will participate nicely as well – for it has a high delta, meaning that the option will appreciate nearly as much as the stock does.
It was mentioned earlier that sometimes these options can be expensive because of the aggressiveness of the option traders who are initiating the action. In that case, it’s even more important to buy a short-term, in-themoney options, for such an option is less likely to be affected by a sudden decrease in implied volatility (should a takeover rumor fall apart, for example).
We have written other aticles in the past, detailing when it is more appropriate to buy longer-term options, and perhaps even an occasional out-of-the-money option (if you’re buying LEAPS, for example), but those strategies are not part of this discussion. If you wish to learn more about those, you might want to purchase some back issues or the educational CD on “Speculative Option Buying.”
Follow-Up Action:
We are firm believers in cutting losses and letting profits run. Of course, so is everyone. However, most people find it hard to do – an attitude that is not helped by the media’s insistence that this is a difficult task to accomplish. Actually, we disagree with that assessment – cutting losses and letting profits run is actually quite simple if you are a disciplined trader.
You cut your losses by setting a logical stop initially and sticking to it. Alternatively, you buy options and limit your risk by only investing a small, fixed percentage of your account in any one trade – say 3% or less. In either case, your losses are small when they occur.
You let your profits run by using a trailing stop once the position begins to make money. In this manner, you lock in some profits, and you are able to ride along if a very strong trend develops. This is far better than using targets. Most of the time, my observation of people that use targets is this: 1) they stay in a position too long waiting for the target to be hit, thus allowing gains to turn into losses, or 2) the stock blows right through the target, and the trader loses out on a major portion of that blow-out move because he exited at the target. In a more general sense, suffice it to say that most fundamental analysts use targets, and we think that is preposterous – they can barely get “buy” and “sell” straight, much less advise someone on a target price. Of course, what they are really doing is trying to estimate price/earnings ratios, but they’re woeful at that (even if they’re good at the “earnings” part). I’m not saying I can set targets any better; I’m saying don’t use targets at all – using a trailing stop instead.
The first graph below shows a stock that had a strong move. The stock is Sandisk (SNDK) – one of this fall’s big winners, at least for a while. The simple 20-day moving average is drawn on the chart as well, and it is the trailing stop. We recommend that you use it as a closing stop. That is, if the stock closes below the 20-day moving average on any given day, then exit your position. SNDK is a stock that we purchased in our Daily Volume Alerts newsletter back in September. The stock then went on a fairly spectacular run – gaining 20 points in about five weeks. This advance was much more rapid than past movements might have led one to expect. That is, if one had been using a target for what ostensibly was to be a short-term trade, he probably would have gotten out after a 6- or 8-point gain. In this case, we stayed with the stock as long as its momentum was intact, using the 20-day moving average as a trailing stop. Eventually, we exited when it closed below that stop in mid- November.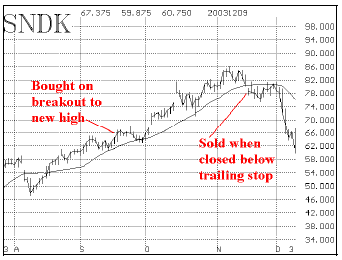
Similarly, a 20-day moving average can be using to let profits run in a bearish position, as well. The graph below, of Micron Tech (MU), in 2000, shows this clearly.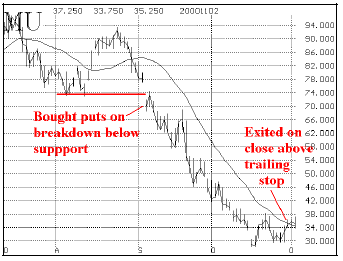
There are some other considerations regarding follow-up action, as well. First, one might want to take a partial profit on a fourth or a third of his position on a profitable initial move, just to pocket some gains – and then use the trailing moving average for the balance of the position.
Also, if one is trading options, he might want to roll them to protect gains as well. Look at the preceding chart of MU, in late September. The stock was trading at 46, but the 20-day moving average (the trailing stop) was at about 68. That’s not much in the way of protection, is it – with the stop 22 points higher than the current stock price? In this type of situation, we would roll the puts that are owned down to an at-the-money put – thereby taking a big chunk of credit out of the position, and limiting risk on any further rallies. Specifically, if one had originally bought puts with a striking price of 70 (the stock was near 70 when the position was taken), then he might roll them down to a put with a striking price of 45 or 50 at this time when there was such a big discrepancy between the current stock price and the trailing stop.
We generally employ these follow-up strategies in our positions. This is how we decide when to roll options, how to set stops, and how to let profits run. These techniques work for any speculative trade – no matter what criteria you used when you entered the position. So they work for “volume alert” trades as well as “put-call ratio” trades, or trades established with your own criteria.
If you’d like further information on our Daily Volume Alerts service, click here.
This article was originally published in The Option Strategist Newsletter Volume 12, No. 23 on December 11, 2003.

© 2023 The Option Strategist | McMillan Analysis Corporation