
By Lawrence G. McMillan
This article was originally published in The Option Strategist Newsletter Volume 13, No. 13 on July 8, 2004.
This subject of risk is one that we have addressed in the past. In this article, we’ll not only review the basics of risk management, but will also introduce a more advanced technique designed to even better assess your risk and adjust your position size accordingly.
There are two facets to trading: position selection and risk management. Many traders feel that the latter is more important than the former. In fact, some have gone so far as to say that any reasonable method of selection will work as long as one has an excellent method of risk management.
Part of risk management is cutting your losses and letting your profits run. This is not hard to do, contrary to what traditional analysts might say. The problem with most “traditional” analysis is, it’s generally wrong. For example, most fundamental analysts use targets and they also average down if they still like the earnings outlook for a stock. Both of those tactics are hideously inappropriate for a trader or an investor. They take you out of a strong position and they keep you in a bad one – just the opposite of what you should be striving to do. Rather, one should set a stop to begin with and adhere to it. That’s the way to cut your losses. Then, let your profits run by using a trailing stop on your positions.
It really doesn’t matter which method of trailing stop you use – a simple 20-day moving average will do, as will an exponential moving average, or something fancier such as a parabolic stop or a Chandelier stop. The point is, you want to let your profits run and only exit the position if the trend ends (or fails to develop). In this way, if you are fortunate enough to latch onto a strongly trending trade, you will be able to milk it for all it’s worth.
The figure below shows how using the moving average as a closing stop looks – for both a long position (first below) and for a short position (second).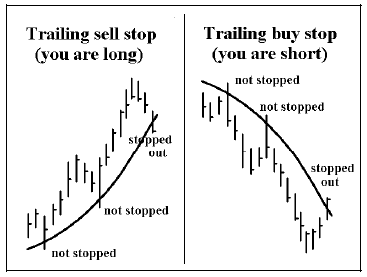
Using a trailing stop doesn’t prohibit you from taking partial profits – a strategy that we often espouse for a third or a quarter of a position that has built up an early profit.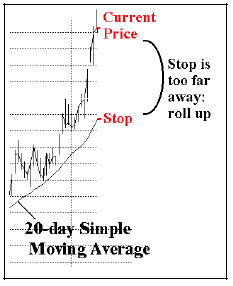
Also, if your position goes truly parabolic in your favor, then your stop will be too far away from the current price and will be relatively meaningless. In that case, you should roll up into an at-the-money option. That is, exit your heavily profitable position – either an option (which is presumably deeply in-the-money by this time) or the underlying – and replace it by buying an at-the-money option. The figure above shows how this situation might occur for a long position. On the last (rightmost) bar of the chart, the stock has advanced so quickly that it is well above the 20- day simple moving average that is being used as the trailing stop. Hence it is time to take the large profit on what you own, and replace it with an at-the-money call. Similar tactics can be taken with short sales when the underlying stock plummets and is well below the trailing moving average: cover your short (or sell out the long puts you own) and replace it with an at-the-money put purchase.
Selecting Position Size
These techniques are mechanical, though, and don’t really address the problem of how much risk to take in the first place. In other words, it’s all fine and good to talk about using a initial stop and then protecting profits with a trailing stop, but how much risk should you take in the first place? Alternatively stated, how many contracts or shares should I buy?
This is the other facet of money management that is crucial. For if one risks too little or risks too much, even with a nicely profitable trading system, he will not experience “optimal” results.
There are several excellent treatises on the subject, some of which are just articles in the quasi-academic environment, and others are books – such as Optimal f by Ralph Vince.
One simple and practical approach is to risk a fixed percentage of your account on each trade. In this way, you are generally operating in the proper manner – increasing your trading size when you are winning and decreasing it when you are losing.
We often advise risking 3% of your trading account on any one trade, for example. Note the operative word is “risking,” not investing.
  Example: you have a $100,000 account and want
  to risk 3% ($3,000) on the next trade in your
  trading system. According to the parameters of
  your system, the next stock trade you are
  contemplating has a risk of 5 points. Thus you
  would buy 600 shares of stock (3%, or $3000,
  divided by the risk, 5 points). This would be true
  whether the stock were a $20 stock or a $100 one –
  as long as your system is “asking” you to risk five
  points on this trade. Thus, you might be investing
  well more than 3% in this one trade, but you are
  only risking 3% (assuming that the stock can be
  exited if a 5-point loss occurs – a reasonable
  assumption if the trading system has an established
  track record).
     If you use options instead, the same principle
  applies, but you first must estimate the risk of the
  option. Suppose that you are going to buy a
  slightly in-the-money call instead of buying the
  stock. Furthermore, you are going to exit your
  option if the stock falls 5 points (the exit dictated
  by your trading system). You use the Black Scholes
  model and determine that the option would lose 3 points
  ($300) if the stock fell 5 points. Thus, you would buy
  10 options for this trade (the 3% risk, $3000, divided
  by the risk on one option – $300).
More Advanced Approaches
If you adhere to the methods suggested above, you should do well in terms of risk management and position size. However, there are more advanced techniques that some traders apply. Using a 3% investment neither optimizes our position size nor does it take into account any probabilities of the system losing money on this particular trade. That is, in the above example, there was no indication of how probable it was that the stock might fall 5 points.
Consider these two trades and prospective stops: 1) Buy XYZ, a low volatility stock, with an initial stop placed only 25 cents below the current stock price, or 2) Buy GOGO, a high volatility stock, with an initial stop placed 5 points below the current stock price.
In our theoretical $100,000 account, we’d buy 12,000 shares of XYZ ($3000 divided by 25 cents risk) or 600 shares of GOGO ($3000 divided by 5 points risk). Is that really what you’d want to do – to buy 20 times as much XYZ as GOGO? Even a low-volatility stock has a high probability of stopping you out on such a tight stop. (As an aside, it has been proven by many system designers – Larry Williams, in particular – that if you set the stops too tight, you can ruin any system).
What we’d really like to know in this case is what the probability is of each of these stocks hitting the stop point? Suppose that the system we are using has an average holding period of 5 days. So, we could use a probability calculator (such as our Probability Calculator 2000) and a volatility estimate (perhaps the 20-day historic volatility of each stock) in order to determine a better ratio of investment for these two stocks.
Suppose that we find that the probabilities of hitting the stops at any time during the next five days are:
XYZ: 60% probability
GOGO: 30% probability
In other words, the risk of losing our $3000 is twice as great in the low volatility stock, because the stop is too tight! Now, if your system demands that the stop be placed that tightly, then you have two choices: 1) don’t take the trade at all, or 2) adjust the position sizes to give an equal probability of losing in each position.
The following formula will make the appropriate adjustment, where q is the probability of the stock ever hitting your stop during the average life of the trade, and s is the stop in points:
(1) Risk-adjusted quantity = R x (1 – q)/s where R = percent of our account that we want to risk. Under this formula, the quantities would become:
   Buy 4800 XYZ [(3000 x (1 – 0.6) / .25]
   and buy 420 GOGO [3000 x (1 – 0.3) / 5]
In this case, you are now buying only 11.4 times as much XYZ as GOGO, and each position has been adjusted for the probability of losing money if stopped out. Another way to look at it is this: we would only invest the full 3% of our trading account if there was no chance of being stopped out (which would only be the case if the stop were placed so far away as to be impractical). Otherwise, we invest a lesser amount – in line with the probability of not losing the maximum amount.
The Kelly Criterion
The above method is a better way of adjusting position sizes between various trades, but it still relies on a rather arbitrary 3% of our trading account as the ultimate risk. Is this really the “correct” amount? No. Actually, formulae created by J. L. Kelly, a scientist at Bell Labs, in 1956, have been applied by many gamblers and investors in order to determine the optimal amount of your account to risk. There isn’t space here to go into the background in detail, but you can “Google” things like “J. L. Kelly” or “Kelly Criterion” and find plenty of papers to read, if you like math. Also, there is a section in the last chapter of McMillan On Options that discusses this subject with examples.
Simplistically, the Kelly Criterion is this:
    (2) Amount to risk = ((r + 1) x p – 1) / r
  Where r = average win/average loss of your system
    and p = probability of a winning trade.
These two figures are known for most trading systems, or can be estimated from back-tested data. If formula (2) yields a negative number, then don’t take the trade.
It occurred to me that one could use the probability calculator and both of the above formulae to help find a better estimate of how much to risk, given the parameters of a given trade. For instance, in the GOGO example above, one is risking 5 points (and we saw that the probability of that risk materializing was 30%). In addition, suppose that we look at the chart or otherwise estimate that we will take partial profits and begin to use the trailing stop if the stock advances by 3 points – and the probability of that occurring is 45%.
Thus r for this trade is the win probability divided by the loss probability, or r = 45%/30% = 1.5 (p = 0.45).
Using the Kelly formula, (2), above, we determine that the amount to risk = 8.3% of our account. Then applying formula (1), we determine that we should buy 1120 shares of GOGO.
This may be too large of a quantity for your taste, for now you are risking 1120 shares x 5 points, or $5600. One thing about the Kelly Criterion is that, if in doubt, invest a smaller amount, not a larger amount, because a (long) losing streak is always possible.
Remember, Kelly is designed to optimize your results over a large number of trades, not protect your capital. In fact, one paper by Edward Thorp (author of Beat the Dealer and Beat The Market) indicates that many professional gamblers rejected the system for use in Blackjack, because the probability of one’s bankroll shrinking to any percentage was that percentage itself. That is, the probability of your bankroll shrinking to 50% of its maximum size at any time is 50%! This is partially true because the edge in Blackjack is so small, even for card counters. That loss would necessitate a bad streak of luck, but as we pointed out in the last issue, the “Casino effect” applies – whereby even the casinos can lose money at times. In the long run, the Blackjack card counter would profit because he has the edge, and using the Kelly Criterion would ensure that his profit is maximized. But, in the real world, many of the professionals gamblers just didn’t want that risk.
The Kelly Criterion is best applied if one is making a series of sequential bets, but in reality one usually has several positions open in the markets at any one time. In theory, one would constantly rebalance his portfolio to adjust position sizes so that they reflected the proper ratio of the trading account. In reality, this is impractical except for the largest accounts.
In summary, these more advanced methods of position sizing can improve your profits, provided you are comfortable with the risk.
This article was originally published in The Option Strategist Newsletter Volume 13, No. 13 on July 8, 2004.

© 2023 The Option Strategist | McMillan Analysis Corporation