
By Lawrence G. McMillan
This article was originally published in The Option Strategist Newsletter Volume 16, No. 3 on February 16, 2007.
Last month, we saw the standard put-call ratio experience some very herky-jerky movements on its chart. As we pointed out at the time, those distortions were due to heavy dividend arbitrage in Altria (MO), JP Morgan (JPM), and AT&T (T). Since dividend arbitrage has become much more prevalent in recent quarters, we feel it’s time to examine this issue to see if there is something that needs to be done to “cleanse” the data of this extraneous, but extremely heavy, call option volume.
Dividend Arbitrage
Some readers may not be familiar with how dividend arbitrage works, so let’s define it before examining its effect on the put-call ratios.
Example: suppose that XYZ is paying a dividend of
50 cents and that it is going ex-dividend tomorrow,
which is just a few days prior to February option
expiration. The following prices exist:
  XYZ: 43
  XYZ Feb 40 call: 3
  XYZ Feb 35 call: 8
  XYZ Feb 30 call: 13

An arbitrageur can attempt a dividend arbitrage by
buying a 5-point or 10-point differential call vertical
spread for parity (i.e., buying the 5-point differential
for 5). He can also set up a potential arbitrage by
selling the call vertical spread for a credit equal to the
difference in the strikes. Once the position is
established, the arb then exercises his long options in
the spread, leaving him with a covered call write
heading into the ex-dividend date.
 For example, suppose the arb does this:
  Buy 100 XYZ Feb 35 calls @ 8
  Sell 100 XYZ Feb 40 calls @ 3
  Exercise 100 XYZ Feb 35 calls

 Resulting position:
  Long 10,000 XYZ
  Short 100 Feb 40 calls
Now the arb waits to see if he gets assigned on all of
his Feb 40 calls the next day, on the ex-dividend date.
If he does, then he has lost a small amount of money
in clearing fees (he trades without commissions). If
he does not get assigned on all the calls, though, he
makes $50 per option that does not get assigned. He
merely has to hold the resulting covered write for
few days until expiration – hoping that the stock stays
above his strike.
There are nuances to the aribtrage, but this isn’t a course in arbitrage, so suffice it to say that carrying costs are meaningful, and also note that the arb could buy Feb 40 puts after the ex-date to protect his remaining position (assuming there is a remaining position) by converting it into a conversion arbitrage.
The arbs only make money if some people forget to exercise their long calls, and therefore allow dividends to go the arbs. The chances of the arbs “getting away” with any dividends are proportional to the amount of “non-arb” open interest in the calls (for the arbs will assuredly exercise all of their long calls).
The huge amount of dividend arbitrage activity in recent months has its roots in more than monetary gain. Apparently, market makers have to do a certain amount of volume in many cases in order to meet a monthly requirement, so dividend arb is an easy way to do it, while still having a small chance to make some money.
The Effect On The Put-Call Ratio
“Purist” technicians say that the data should never be altered; it just has to be used as it is. For the most part, I would agree with that. But there are certain situations where there is just too much extraneous data to ignore. One of these, in the past, was the NYSE advance-decline line. When it began to measure advances and declines on too many “non-stocks,” we instituted our “stocks only” data and oscillator.
Now, it appears to be time to install some screening in the equity-only put-call ratio calculations to eliminate obvious dividend arbitrage situations. We already do this for the weighted ratios, where we eliminate any obvious distortion by discarding options where dollar volume is exorbitantly large.
Here are three examples of extremely heavy dividend arbitrage that occurred near year-end:
Stock   Date     Call Volume   “Normal”
                              Call Volume
MO    12/21/06   4271703       26509
JPM   12/29/06   3379207       19719
T     1/5/06     3049209       10423
It doesn’t take a genius to see that the call volume on the date shown was outrageously out of line with the “normal” call volume.
How would this have changed the standard put-call ratio? It would have made it much more in line with the weighted ratio, it would have made it easier to read or interpret, and it would have made the signals clear – as opposed to the rather equivocating interpretations we were forced to give as it flopped back and forth because of the dividend arbitrage distortion.
The “raw” equity-only put-call ratio is shown below. You can see its “choppiness.” It was very unclear which way the ratio was trending, because those heavy dividend arb days forced it downward, and then 21 days later –when they came off the moving average – the ratio jumped higher.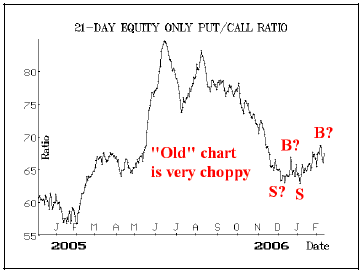
Below, is the “adjusted” ratio, with the dividend arbitrage removed. The only data that has been removed is the above-average call volume on those three stocks listed above (MO, JPM, and T) on the days in question. Just that simple adjustment produces a much clearer picture. A clear sell signal was issued in December, followed by a clear buy signal in January.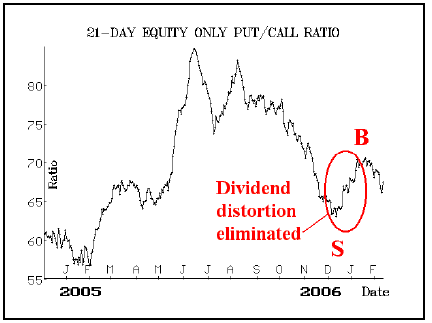
Finally, the weighted ratio is also shown so that you can see how the “adjusted” ratio much more closely resembles the weighted ratio now. You can now see that the buy and sell signals from the two lower charts agreed at more or less the points in time.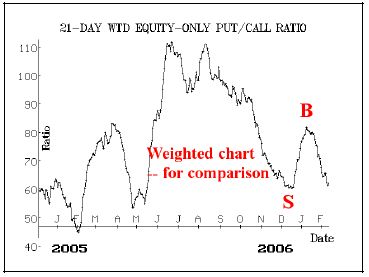
There have been other times in the past where dividends have distorted the standard ratio, but I can’t recall the distortions being as pernicious as they were this time around. Moreover, we are about to enter into another heavy dividend-paying period soon.
So we are immediately going to insert code into our programs that compute these ratios – eliminating excessive, dividend-related call volume. We will continue to monitor the deletions, of course, to ensure that only dividend arb data is discarded – and nothing important to the integrity of the actual calculations.
In summary, we generally try not to “fool” with the data of contrary indicators, even though much of it is not the result of actions by the public investor. One has to generally live with the extraneous option activity generated by covered writes, spreads, and arbitrage – little of which has predictive value. However, these large dividend arbitrage distortions were just too obtrusive, so we feel compelled to isolate and eliminate them from the put-call data.
Individual Stocks, Too
This elimination of the data will have an interesting, and hopefully beneficial, effect on the put-call ratio charts of individual stocks as well. If you see the “raw” chart of a stock where dividend arbitrage was heavy, it has a spike down and then up again 21 days later, completely distorting the chart and making it very difficult to read or interpret. If you are a subscriber to our weekly put-call charts or if you have looked at some of them on The Strategy Zone, you’ve seen the distortions that this dividend activity creates.
This refinement should improve those individual putcall ratio charts for stocks as well. Hopefully, the standard charts in these situations will once again become more useful, joining their weighted brethren as a viable tool for stock price forecasting.
This article was originally published in The Option Strategist Newsletter Volume 16, No. 3 on February 16, 2007.

© 2023 The Option Strategist | McMillan Analysis Corporation