
By Lawrence G. McMillan
This article was originally published in The Option Strategist Newsletter Volume 17, No. 6 on March 27, 2008.
Amongst our array of technical indicators is the put-call ratio. We use it extensively in analyzing the broad market (equity-only putcall ratios) as well as individual stocks and, especially, futures. It is less useful in the indices and ETF’s, but sometimes has validity there, as well. Furthermore, we use $VIX derivatives – particularly the futures – as predictors of short-term moves in the broad market as well. These $VIX derivatives have been very useful and accurate indicators, with two or three great “calls” again in the last week. So, the question becomes, should we be looking at put-call ratios on $VIX – trying to combine these two indicators which, separately, have proven to be quite useful in their own right? As you shall see, the answer is not completely clear, but there does seem to be some usefulness in $VIX put-call ratios.
Whether it tells us anything we wouldn’t have gleaned from other indicators is something that must be determined, though. Otherwise we’d just be wasting our time, calculating technical indicators without gaining additional insight.
One other thing: for a long time, I have felt that trying to interpret index charts with too sophisticated of a technical analysis approach is not useful. That would certainly be true of $VIX, which we must remember is merely a reflection of option premium levels on the two front months of S&P 500 ($SPX) options traded on the CBOE. $VIX can’t just go its own way; it is tied to certain other variables. Thus, for example, I don’t think utilizing stochastics or other sophisticated techniques on $VIX itself is useful.
On the other hand, we do know that traders of $VIX derivatives (futures and options) have established a favorable track record (albeit over a fairly short historic period of time – four years). So we may find some useful information here.
The "Standard" Put-Call Ratio
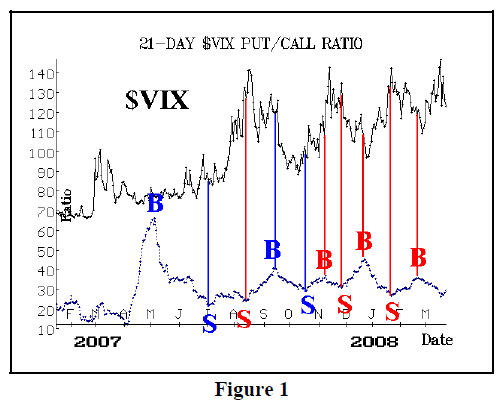
The chart in Figure 1 is that of the “standard” put-call ratio, using the $VIX options traded on the CBOE. This is our regular way of looking at these ratios, using a 21- day moving average as a contrary indicator.
First of all, notice how low the put-call ratio is, by observing the scale on the Y-axis. The ratio mostly ranges between 20 and 50. “20" means that only 20 puts are trading for every 100 calls. This low ratio means that call buying dominates $VIX option trading. This should not be totally surprising, for traders are learning that it is a feasible strategy to buy $VIX calls to protect a portfolio of stocks. We have shown in past articles that that protective strategy is much more dynamic and efficient than buying $SPX puts to protect a broad-based portfolio of stocks.
Which brings up another point: when hedgers are operating heavily in a market, the put-call ratios are often very ineffective. In the above chart, the red signals are more or less successful ones, while the blue ones are not. It’s not a particularly great track record, especially since one must realize that the signals are probably recognized 2 to 3 days later, in real time, since this is a 21-day moving average.
Even if the signals were successful, what are they predicting? They are predicting the price movements of $VIX, which are generally opposite of what the stock market is doing (that is, when the market goes down, $VIX goes up). So, in theory, if you were going to use this chart to try to trade the stock market (in practice, I wouldn’t – it doesn’t look like it is good enough), you’d sell the stock market when the chart says to buy $VIX.
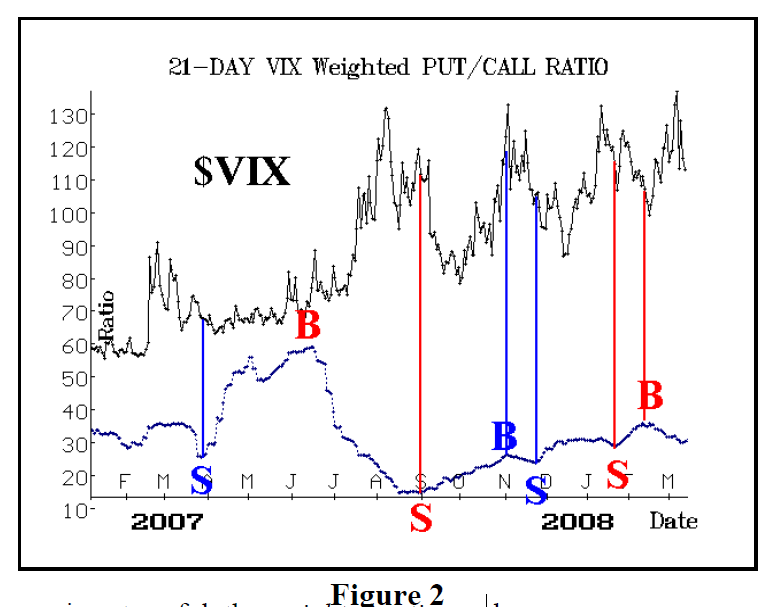
Now, we know from QQQQ, $OEX, and other indices or ETF’s, that sometimes when the standard ratio is not useful, the weighted ratio can be.
Figure 2 shows the weighted ratio of $VIX options. The signals here aren’t much better. Yes, there was an excellent buy signal for $VIX last July (and that would be interpreted as a sell signal for the broad stock market). And there was a decent sell signal for $VIX right around the beginning of September, 2007 – a bullish signal for the stock market.
But, after that, the ratio has been slowly climbing ever since, missing out on some very tradeable situations in October, November, December, and January. Finally, it gave a buy signal for $VIX (a sell signal for the stock market) in mid-February that caught the last part of the decline into the recent retest of the $SPX lows.
If these were the only indicators we had, we might be inclined to try to use them and squeeze some signals out of them. But, in reality, we have indicators that are much better than Figures 1 and 2. So, at this point – and we can re-visit this issue at any time – we’d have to say that trying to interpret $VIX option data in the traditional contrary manner, using 21-day moving averages, is not a very good use of one’s time or resources.
Can $VIX Option Data Be A Direct Indicator?
We know that the premium level of futures is a direct market indicator – not a contrary one. In other words, when the $VIX futures are at a discount, they are “predicting” that $VIX will decline, and we know that a decline in $VIX normally accompanies a broad stock market rise. And that’s what has generally happened – the market rises when the $VIX futures trade at a large discount. That’s a direct indicator. There are no contrary interpretations there.
So, could it be possible that $VIX options are a direct indicator as well? Bob Lang, an analyst with Bigtrends.com, first floated this idea to me, and while it’s not perfect, there have been some good trades out of it. The idea is that, rather than looking at the $VIX option trading as an intermediate-term contrary indicator, as is the case with our normal interpretation of put-call ratios, we look at the ratio as a direct indicator of short-term (daily) market movement. So, if there is a lot of call buying on $VIX on a certain day, then those traders are “predicting” that $VIX will rise, and thus the broad market will fall. If they’re right, it’s a direct indicator. Short Sale System:
Here’s an example. The lowest ratio ever recorded for a single day of $VIX option trading was 12/28/2006, when 90,220 calls traded and only 1,860 puts traded. The put-call ratio was 0.02. That means a very large percentage of traders were buying $VIX calls. If the “direct theory” is correct, the market should have declined the next day, and indeed it did – $SPX fell 6.43 points.
So, let’s test this theory. We had 320 trading days of $VIX option data on file. We calculated the ratios for every day, appending the $SPX movement for the next day, and then sorted the results by the ratios, from lowest to highest. When the ratio is very low, one would want to short $SPX for the next day. So, since ratios are mostly low, our initial look was to see how the ratio was as a predictor of shorting $SPX for the ensuing day.
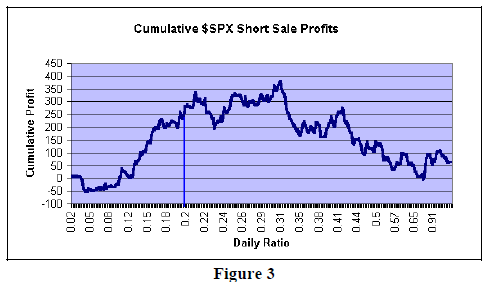
The results are shown in Figure 3. The put-call daily ratio is shown along the X-axis, and the cumulative profits from shorting $SPX for one day are shown on the Y-axis.
As an example, there is a line drawn at a ratio of 0.20. You can see that the Yaxis value corresponding to that is about +250. That is, if you had shorted $SPX every day on which the daily $VIX put-call ratio was 0.20 or lower, your cumulative profits for all of those trades would be 250 $SPX points. That’s certainly something worth trading. We’ll refine this more in a moment, but note that there were 98 such trades in the 320 days of data – a lot of trading!
What’s very unusual is that the lowest ratios didn’t produce any profit at all! Looking at the left-hand side of the X-axis, you can see that the cumulative profits for a ratio of 0.05 were –50 $SPX points! In other words, if you short $SPX on the lowest ratio days, the “system” is a loser. There must be something happening on those days – perhaps large portfolio hedging.
In any case, you can see that the cumulative profit line continues to rise until the ratio reaches 0.30. At that point, the cumulative profit is about 380 $SPX points. So, if you shorted $SPX for one day each time the $VIX daily put-call ratio was 0.30 or lower, you’d have netted 380 total $SPX points in the last 320 trading days.
The full data set yields this result: 176 trades, 91 profitable (52%), avg short sale gain: +12.57 $SPX points, avg loss –8.98 points. These results can be improved by ignoring signals on days when the daily put-call ratio is 0.05 or lower. The total profit increases to 427 $SPX points. The percent of winning trades increases to 53%, the avg gain increase to +13.2 $SPX points, while the avg loss is –9.3 points.
Trading From The Long Side: You can also see, from Figure 3, that the cumulative profit graph from short sales begins to decline at ratios above 0.30. That means a long position would be making money. So, as a corollary, if we went long whenever the daily $VIX put-call ratio was higher then 0.30, we’d have another winning system. 133 trades (59% profitable), total gain 317 $SPX points, avg win +12.4 points, avg loss –12.3 points.
So, the good news is that we have found something that seems to work fairly well. The bad news is that it trades nearly every day. I don’t like systems like that. Let’s see if we can eliminate some other “dead” areas.
One might think that he could eliminate some of the trades in the “middle” around a 0.30 put-call ratio. However, if you look more carefully at Figure 3 at the bottom of page 3, you’ll see that there is clearly a spike on the chart at that point (0.30). That is, both short sales at ratios just below 30 and longs at ratios just above 30 were both very profitable. Eliminating them from the “system” would be very harmful.
For example, these ratios, and hence trades, were indicated by the system:
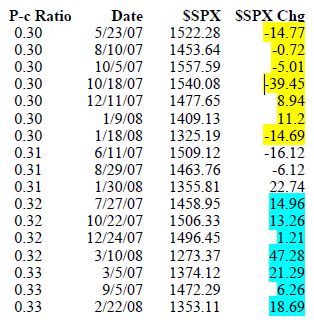
You’d certainly want to include the .32 and .33 ratios as buy signals, since every signal was profitable and some of the moves were huge: +47, +21, +19, etc. Conversely, you’d want to include 0.30 as short sales because of the –39 and –14 days included in there. There is a slightly mixed result at a ratio of 0.31 (3 trades, which about broke even when all three are totaled), so 0.31 could be the eliminated “dead zone,” but that’s pretty narrow.
We could also eliminate some of the highest ratios as buy signals. Again, looking at Figure 3, note that on the right hand side, the cumulative profit curve bottoms out at a ratio of about 0.70 and then rises and flattens after that. Hence, buying $SPX on days when the ratio was larger than 0.70 didn’t produce a net profit. Again, I’m not sure why. Perhaps it will become clearer with the passage of time and accumulation of more data.
So, at this point, we can refine the system slightly to read as follows: If the $VIX daily put-call ratio is between 0.06 and 0.30, short $SPX for the next day; conversely, if the ratio is between 0.32 and 0.70, buy $SPX for the next day.
The following table summarizes the results for this trading system, over the past 320 trading days.
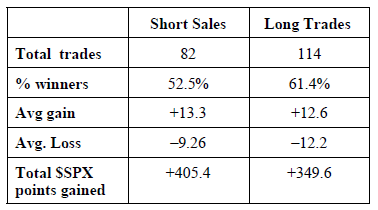
As active as this is, it’s a good system and hard to ignore. I don’t think I’ve “optimized” too much by eliminating the “wings” (Ratios below 0.06 and above 0.70), but one could take those trades, too, if he wished. We’ll monitor this system and keep track of it on an ongoing basis. Meanwhile, we will use it in our daily services, as an adjunct to other indicators.
This article was originally published in The Option Strategist Newsletter Volume 17, No. 6 on March 27, 20008.

© 2023 The Option Strategist | McMillan Analysis Corporation