
By Lawrence G. McMillan
This article was originally published in The Option Strategist Newsletter Volume 4, No. 9 on May 11, 1995.
We have written about the usefulness of the equity and index put-call ratios in attempting to predict the direction of the stock market. The ratios are useful in that we can see when "too many" puts or calls are being bought and interpret them in a contrarian manner. For example, if "too many" puts are being bought, then speculators are bearish and, by contrarian thinking, we should be bullish. The main problem with any contrary indicator is in determining what is actually making up the data.
For example, if money managers are actually bullish — but perhaps nervously so — then they might buy stock and buy puts at the same time. This would distort the put-call ratio statistics, as the put buying by these money managers is not really a bearish speculation, but rather a hedge against a bullish speculation. In any case, the indicator is a useful one when extremes are reached.
One area that is relatively unexplored, or at least unpublicized, is the use of put-call ratios in predicting futures prices. Part of the reason for this is that futures options can be rather illiquid and are often used as hedges rather than speculation. Such a usage presents problems similar to those just described regarding index options. However, in futures contracts where the options are active, they can sometimes be useful in predicting the movement of the underlying futures. The most useful times occur when extremes are reached.
This differs somewhat from the interpretations we make using stock and index options. For those heavily-traded options, we tend to view each and every change of direction of the put-call ratio as a buy or sell signal. This is impractical for futures options since they are much less liquid and since the put-call ratio changes direction quickly and dramatically. The chart below shows the 21-day put-call ratio for Gold futures options over the last 300 trading days. All gold options are included for the various forward month futures contracts that existed on the day in question.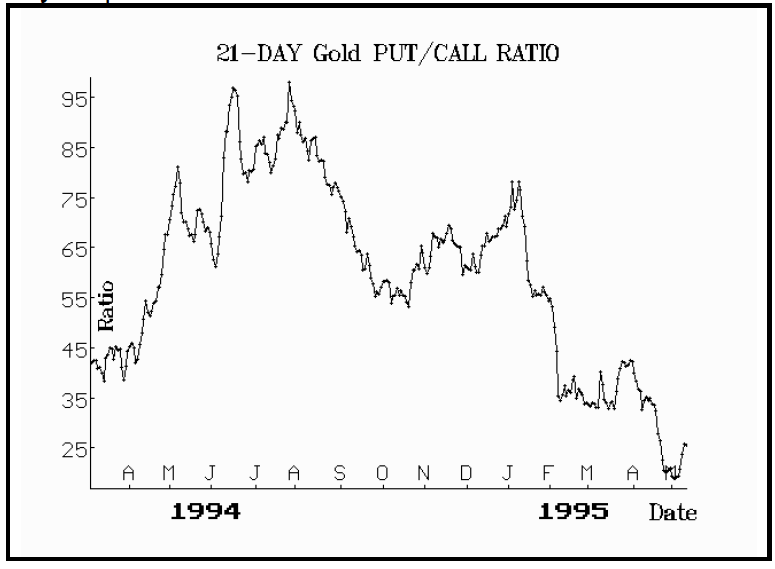
The put-call ratio rose to extreme heights in the April-June period of 1994. At that time, the number of puts traded on a given day was nearly equal to the number of calls. As you can see by the rest of the chart, that is a very high number as far as gold options are concerned. Therefore one would have to consider that gold was a buy at that time.
Now look at the chart of June Gold futures for the 1994 time period (next column). You can see that gold was trading down rather slightly from about 400 to 370 as the put-call ratio was skyrocketing. Eventually, the put-call ratio peaked just as gold bottomed around 380 and rallied all the way to 410. This shows the usefulness of using the put-call ratio for predicting the movement of futures contracts.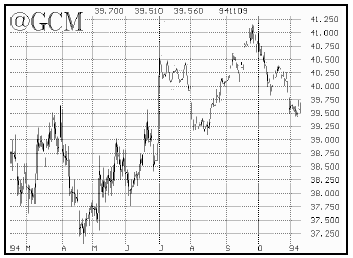
Now look at the right-hand side of the above chart. You can see that the put-call ratio has dropped to extremely low levels — almost 5 calls were trading for every put at the beginning of May, 1995. This is extreme bullishness, and so by contrarian theory, gold should be sold (short). Not surprisingly, a similar situation exists in Silver at the current time. The 21-day put-call ratio for silver is shown in the graph below. You can see that it reached neither the height nor the depth of the gold put-call ratio chart. The silver put-call ratio bottomed (i.e., gave a sell signal) almost a month ago, which was premature. In any case, it is also on a sell signal, so aggressive traders would want to be short the metals and longterm holders may want to take out some protection in the form of long puts. We are not making a model portfolio recommendation since the metals have already broken down in trading this week.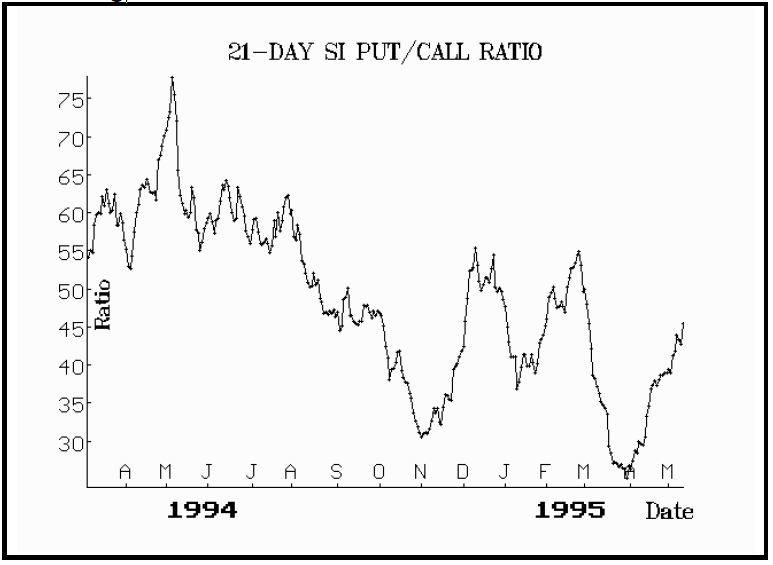
There is another futures contract where put-call volume is running at extreme levels, and that is Unleaded Gas. The entire oil and oil product group has been rallying in recent weeks, and bullishness has now reached extreme levels. Nowhere is this extreme more evident than in Unleaded Gas. The put-call ratio graph is on the next page. First, notice that the put-call ratio reached a high (buy point) in January, which was actually a little premature, since the current rally didn't really get rolling until February. At the present time, you can see that it recently traded at the lowest levels of the last 14 months. This is a negative turn of events and we think a top is near in this contract. We therefore want to establish a bear spread.
       Position F78: Gasoline Bear Spread
          Buy 3 Unl Gas July 61 puts
         and Sell 3 Unl Gas June 61 puts
         Risk Rating: Below Average Risk
        1.00 = $420; June exp 5/19/95; July exp
6/23/95
June Futures: 63.40           June 61 put: 0.30
July Futures: 61.30           July 61 put: 1.55
Profitability: This is a bearish spread even though the two puts have the same striking price. Notice that the futures are trading at prices essentially 2 points apart. Therefore the July put is atthe- money, while the June put is out-of-the-money. Hence, buying an at-the-money put and selling an out-of-the-money put is a bear spread. The spread will make its maximum profit if June Unleaded Gas futures trades at 61 or lower. The maximum risk — which is the initial debit of the spread — would occur if all the options expired worthless; i.e., if July Unleaded Gas futures were above 61 at their expiration. Investment: The position must be paid for in full. At the above prices, that would be $1575, plus commissions. Follow-Up Action: If the June put expires worthless, we may sell an out-of-the-money July put at that time to lower the debit of the spread. Otherwise, take no defensive action.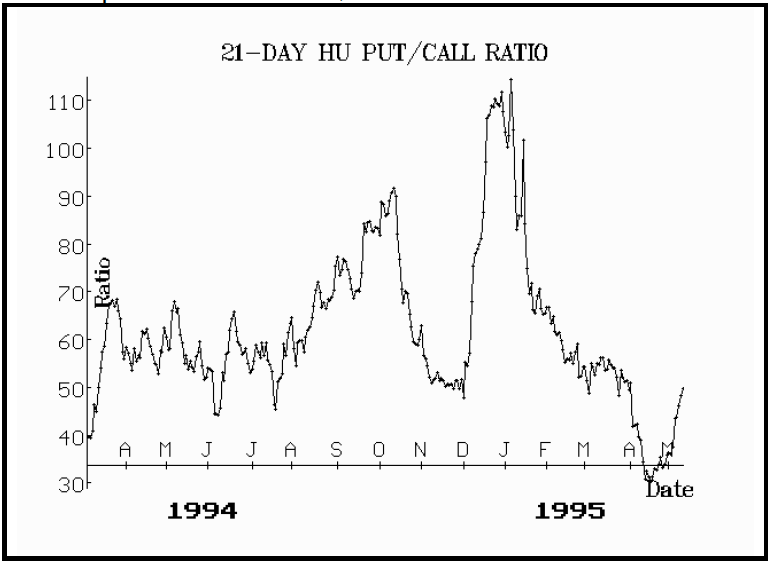
This article was originally published in The Option Strategist Newsletter Volume 4, No. 9 on May 11, 1995.

© 2023 The Option Strategist | McMillan Analysis Corporation