
By Lawrence G. McMillan
This article was originally published in The Option Strategist Newsletter Volume 22, No. 22 on November 29, 2013.
There are a number of trading systems involving the days before and after Thanksgiving. Some are quite profitable, and some not so much. For some reason, there even seems to be a certain amount of misinformation about one of these systems, although that arises from financial television, which is incorrect, not surprisingly. In this article, we’re going to take a look at three such systems: one encompassing the three trading days prior to Thanksgiving, one looking only at the day after Thanksgiving, and a longer-term one involving a period several weeks after Thanksgiving. This latter one has a few interpretations, so we’ll expand our analysis of that one.
The Three Days Before Thanksgiving
The first system that we’re going to look at is one that we can’t trade because the time has already passed. In fact, we never intended to trade it because it has a very spotty track record. The only reason I’m including it here is that I heard a reporter on CNBC say that the three days before Thanksgiving have been very positive in the past. In fact, nothing could be further from the truth, but unfortunately this is the kind of information one gets from CNBC these days – possibly incorrect, but certainly bullish. As you can see from the data in Table 1, which shows gains and losses in terms of $SPX points made or lost, there hasn’t been any consistently bullish pattern to the three days before Thanksgiving.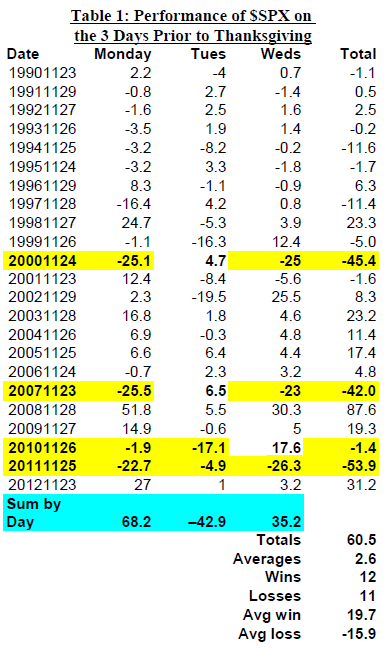
The data in Table 1 extends back to 1990. For each year, the daily change in $SPX is shown for Monday, Tuesday, and Wednesday preceding Thanksgiving. Overall, there have been 12 years where the sum of the three days is positive and 11 years where the sum of the three days is negative. Moreover, the positive years only slightly outperform the negative years, so that for the 23-year period in question, the net profit was a mere 60.5 $SPX points, or 2.6 $SPX points on average. Those results are poor for a system trade, and we would not trade it because of that.
In blue, the sum is shown for each of the three days. So, if one were going to trade at this time, he would ostensibly be better off buying Monday and Wednesday, and perhaps selling short on Tuesday. That approach has had some rocky years, though, so we would not recommend it in actual practice.
Furthermore, upon closer inspection, notice the years and cells highlighted in yellow. These are just a few years that have produced negative results on the three days leading up to Thanksgiving. In 2011, every one of the three days was a negative day (a total loss of 53.9 $SPX points over that 3-day time span). In 2010, Monday and Tuesday were negative. In 2001 and 2007, Monday and Wednesday were heavily negative, and the overall loss was over 40 $SPX points both times. Going further back, there were many more years when being long during the threeday period would not have been too pleasant: 1994, and 1997, for example.
So, what was the announcer on CNBC talking about? Who knows, but it certainly brings into question many of the independent data sources they often cite. As long as data feeds their bullish bias, they are happy to report it, even if it is wrong.
The Day After Thanksgiving At one time, there used to be some benefit to trading the day after Thanksgiving. However, that was when there was a full day of trading on that Friday. In recent years, the Friday after Thanksgiving has been only a half-day of trading – as it is again this year – and therefore the movements are theoretically subdued as most traders stay home.
The data below show that there is only a slight upward bias to the day after Thanksgiving.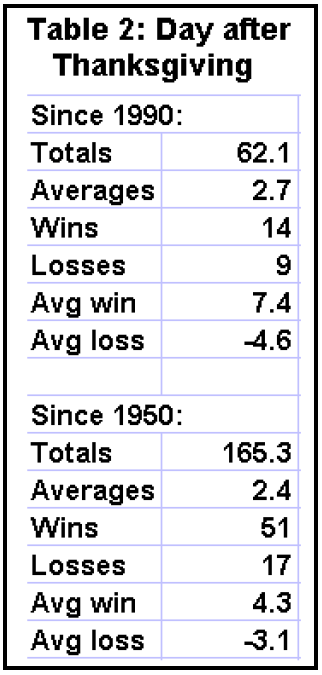
Even so, in five of the last six years, there has been a rather substantial move on the day after Thanksgiving: Table 3 shows the results, in $SPX points, for the last six years. Unfortunately, there isn’t any clear direction here, as three years were up and three years were down.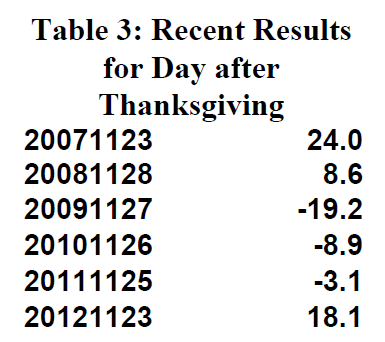
So, while this data for trading the day after Thanksgiving may be interesting, it is not particularly useful.
Post-Thanksgiving Seasonal Trade
The system that we have traded in recent years, is this – the Post-Thanksgiving Seasonal Trade. Originally, we bought “the market” at the close of trading on the day before Thanksgiving and held with a trailing stop into December.
Although we have had successful trades in the past few years, that style of trading is difficult to backtest because one has to specify exactly where and how the trailing stop is determined and placed.
Recently, Jay Kaeppel, a well-known technical analyst suggested that the trade could be coupled up with the “Santa Claus Rally” system (originally identified by Yale Hirsch).
The Santa Claus Rally encompasses the last 4 trading days of one year and the first two trading days of the next year. It is generally a bullish six-day period. So Jay Kaeppel suggests linking the two systems together: buying “the market” at the close of the trading day prior to Thanksgiving and holding through the close of the second trading day of the new year.
Table 4 shows results for the last 23 years. This has been a winning trade in 20 of those years (87% winners). Moreover, the average trade is a gain of 2.9% in the S&P 500 Index ($SPX).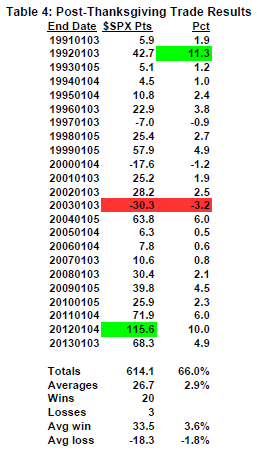
Note that the total gain for the 23 years is 614.1 $SPX points. If one had invested the same amount in $SPX each year, he would have gained 66.0% on that investment, cumulatively, over the 23-year period.
The last three years have been particularly strong – gains of 72, 116, and 68 $SPX points, respectively. There have been gains in each of the last ten years.
These are impressive statistics, so we feel compelled to take the trade.
Jay Kaeppel backtested the trade even farther – all the way back to the trade that ended in early January, 1950. He showed 84.4% winners over that longer time period (54 wins and 10 losses), with the average trade producing a gain of 3.24% in terms of $SPX. The best year in percentage terms was 1992 (as also shown in Table 4), and the worst year was 1978, where there was a loss of 3.7% in $SPX.
What could cause a problem? The biggest problem that I see is that the trade is becoming more wellknown to the “masses.” When that happens, there are a couple of things that occur: 1) traders buy ahead of time in order to “beat” the trade. That might account for some of the market strength in the last few days, and 2) systems have a way of “weeding out” non-believers and/or newcomers, and a losing trade would probably do just that. That may sound a bit superstitious, but I think it’s just reality – no trade works every year (although our October Seasonal Trade had a run of 28 straight years at one time).
One might also cite the fact that “the market” is overbought and there are certain sell signals in place. I wouldn’t weigh that too heavily, though, for as you can see in Table 4, the system even made money in 2007 and 2008, during bear markets.
So, the following recommendation was made in last week’s Hotline. It is repeated here:
Position S728: Post-Thanksgiving Trade
At the close of trading on
Wednesday, November 27th,
Buy 6 SPY Jan (2014) calls
One strike in-the-money
SPY: 181.12 Jan 181 call: 2.63
Since SPY closed at 181.12 Wednesday, the correct call to buy was the SPY Jan (2014) 181 call. Given the newer research, which entails holding the trade all the way through to the end, we are going to hold this without a stop based on SPY. However, there is one criterion that we think would be quite bearish, and that’s a $VIX close above 15. So, stop yourself out of this trade if $VIX closes above 15.
This article was originally published in The Option Strategist Newsletter Volume 22, No. 22 on November 29, 2013.

© 2023 The Option Strategist | McMillan Analysis Corporation