
By Lawrence G. McMillan
This article was originally published in The Option Strategist Newsletter Volume 19, No. 15 on August 13, 2010.
When one hedges risk in his portfolio – whether via broad-based index option strategies or via individual stock options – that doesn’t necessarily end the discussion. Later, especially if the underlying declines sharply in price, one has decisions to make. In this article, we’ll discuss those decisions as they apply to the somewhat popular strategy of “collaring” stock.
The “Collar”
For completeness’ sake, let’s begin by discussing how and why the collar strategy is established. Simply stated, it is a way of completely eliminating downside risk, but the tradeoff is that one must give away some or all of the upside potential beyond a certain point.
The collar strategy has been discussed in the past several times – most recently, issues 17:11 and 17:19 – so we will not go into a lot of detail here, but a simple review of the strategy’s basics follows.
A “collar” is constructed by buying an (out-of-themoney) put and selling an (out-of-the-money) call, typically with the same expiration date – although that isn’t required. The strategy is a logical extension of the simplest protective strategy of buying a put to protect stock.
However, when one establishes that simple strategy, he is laying out money for the put, and over time that can build up to be a relatively large expense. One way to reduce that cost is to sell a call option at the same time the put is purchased. If the call sells for a price equal to or greater than that of the put, then the strategy is called a “no-cost” collar (for the investor does not have to lay out any cash to establish the strategy, in that case).
Just because the collar is “no-cost” doesn’t mean there is no downside risk. There is risk between the current stock price and the striking price of the put. On the upside, there is rising profit potential between the current stock price and the striking price of the written call. A sample is shown in Figure 1, where the initial prices might have been:
    XYZ: 50
    Buy Jan (2011) 45 put: 4
    Sell Jan (2011) 55 call: 4
The strategy can also be established using broadbased index options (in which case, one would finance the “naked” call with the collateral value of his long stock portfolio). A $VIX collar also exists – although that involves a somewhat inverse trade: buying an out-of-themoney $VIX call and selling an out-of-the-money $VIX put (most likely for a debit, though).
Let’s now return to the main purpose of this article – making adjustments to the collar after time passes.
Bearish Adjustments
After the collar is established, the position still needs to be managed – not daily, but usually after the stock makes a sizeable move. If the stock is relatively stable, one would probably not alter the collar. It would be left alone.
The most favorable strategy adjustments come when the stock has fallen. Yes, it is true that a falling stock price creates an unrealized loss in the stock, but it also creates an unrealized gain in the collar. So, by making adjustments and taking some of that gain, one can often open the upside for better profits if the stock rebounds.
There are several things that can be done. The simplest, but not necessarily the best thing is to do nothing. The reason that one might choose this tactic is that – as you will shortly see – the other adjustments to the downside increase the downside risk by some amount. It might be a small amount, but it is still an increase in risk. If one prefers to stay with the position he originally analyzed and established, it could be a reasonable choice.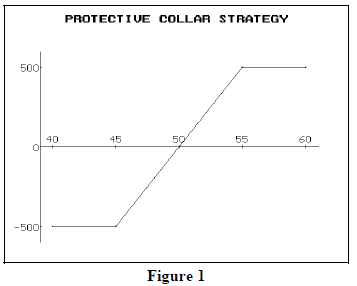
In order to discuss the other alternatives, let’s use a sample position. This is similar to ones that we established in some of our managed accounts in the past. I prefer to establish collars using long-term options. The longer the better. This position was established when the Jan 2012 options were first listed, in the fall of 2009.
   Example: 10/20/2009
   British Petroleum (BP): 56
   Buy Jan‘12 40 puts: 2.00
   Sell Jan’12 70 calls: 2.20
This is a no-cost collar with about 16 points of risk to the downside and about 14 points of profit potential to the upside. At the time, the quarterly dividend was large, although that doesn’t really factor into deciding to collar a stock. Rather, the impetus for the collar was how poorly the stock had performed in the 2008 market meltdown. If another severe decline were to occur, the client wanted some protection. The stock has a very low cost basis, so the client did not want to sell the stock itself.
As anyone who hasn’t been living under a rock knows, BP stock was smashed after the Gulf oil leak. By June 1st of this year, the following prices existed:
   6/01/2010:
   BP: 36.50
   Jan’12 40 put: 10.50
   Jan’12 70 call: 0.90
Obviously, implied volatility had increased substantially by this time – from about 25% when the position was established to about 50% at this time. The puts are only 3.50 points in the money, yet they are trading at 10.50, because of both the large amount of time remaining and the elevated implied volatility.
The June 1st prices were by no means the low for the stock nor the high in implied volatility, but one would, of course, not know that at the time. So, let’s examine some alternatives at this point. Then we’ll look at how they might change as the stock continued to fall.
Roll the Puts Down
One strategy is to roll the puts down to a lower strike. This takes a credit out of the position (and puts it into your pocket), but it increases the ultimate downside risk by the amount of the strike price differential less the credit received.
In other words, consider this trade: Sell (closing) the Jan’12 40 puts @ 10.50 and Buy (opening) the Jan’12 30 puts @ 6.00 One way to think of this is that we are laying a put bull spread on top of the original position. That spread is always a credit spread, and the ultimate risk is: Risk = Difference in Strikes minus Credit Received = 10 – 4.50 = 5.50
In this example, then, we would receive a credit of 4.50 for rolling down 10 points. That would increase the downside risk (if the stock fell below 30) by another 5.50 points (10 minus the 4.50 credit). That didn’t seem like a wise choice with the stock in free fall, so we didn’t roll down at that point.
But as long as we’re using this example, let’s further examine what a roll-down of the puts accomplishes. Anywhere above 40 at expiration, the original position is improved by the credit of 4.50. So, for example, if the stock rallied back to 56, there would be an option profit of 4.50. Or if the stock made it all the way back above 70 by January, 2012, the upside profit would be 18.50, as opposed to the original 14 points profit. Figure 2 shows the comparison of the original collar (line A) with that of rolling down from the 40 puts to the 30 puts for a 4.50 credit (line B). Dividends are not included in the profit graph, nor are commissions.
Buy Back The Calls or Roll The Entire Collar Down
A further refinement would be to use part of the credit from rolling down the puts to buy back the calls and thus remove the upside hindrance if the stock should ever rally back that far.
Or, of course, one could buy back that original short call and sell another call with a lower strike. If this approach were taken, it would a complete roll-down of the entire collar. Consider the following prices, which also existed on June 1st:
  6/01/2010:
  Jan’12 70 call: 0.90
  Jan’12 60 call: 1.90
It hardly seems worth it to take in an additional 1.00 point credit, while lowering the upside “cutoff” point from 70 to 60. However, if one thinks that 70 (or even 60) is no longer attainable (and given the situation with BP, it might not be), then such a roll would bring in additional credits.
Line C on the graph shows what the complete rolldown of the collar from the Jan’12 40-70 to the 30-60 would look like. You can see that if the stock rallies back above 60, case C (complete collar roll-down) would be the worst. However, if the stock is above 34.50 at expiration (but below 61), case C is the best scenario.
The original collar (line A) is best if the stock is below 34.50 at expiration, which is why it we initially pointed out that it might be wise to do nothing, especially if one perceives that downside risk still is probable.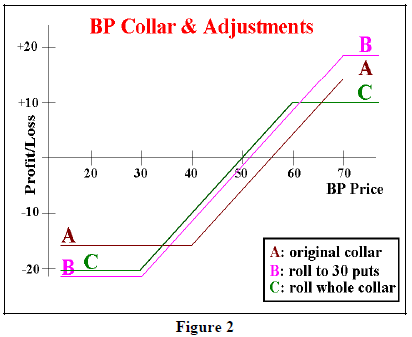
Later, BP fell to 30 (and below) in early July. The prices of the original collar on July 1st, were:
   7/01/2010
   BP: 30
   Jan’12 70 call: 0.70
   Jan’12 40 put: 15.50
Implied volatility had increased to about 70% by this point in time. The Jan’12 30 put at that time was offered at 8.50. Now, this potential roll made more sense. One could roll the puts down 10 points (from 40 to 30) for a credit of 7.00 points (sell at 15.50 and buy at 8.50). That means the increase in downside risk would only be 3 points. That seems to be a much more acceptable roll-down than the one on June 1st.
Merely Sell The Puts
All of the above examples assumed that the trader wanted to keep downside protection in place. But there might be a stock price low enough, or a put price expensive enough that one might consider merely taking the profit on the long puts and not replacing them with another long put. This would obviously expose the stock to further downside moves, but would totally free it up if a rally should occur.
Refer again to the most recent set of prices, on July 1st, with BP at 30. The puts could be sold for 15.50 (it is unlikely that one would buy back the calls as well, since they are so far out of the money, but one could do that too). I f that were the case, the collar that was initially established for a 20 cent credit would be sold for 15.50. That’s a profit of 15.70, which would reduce the original stock cost of 56 down to 40.30. So, by selling the puts now, the stock owner then only has to see the stock rally back above 40.30 to create profits.
Sell Other Puts, Out-of-the-money
In a similar vein, if one feels the stock has reached a bottoming area, but perhaps isn’t quite so certain of it that he feels comfortable with selling his long puts outright, he might sell a put that is out-of-the-money.
As an example, we know what the prices of the collar were on July 1st. Now, also consider the prices of outof- the-money puts:
  7/01/2010:
  BP: 30
  Jan’12 70 call: 0.70
  Jan’12 40 put: 15.50
  ------
  Jan’12 27.5 put: 8.10
  Jan’12 25 put: 6.80
  Jan’12 22.5 put: 5.70
Suppose that, instead of disturbing the collar that is already in place (long the Jan’12 40 puts), one considers selling the Jan’12 25 puts for 6.80 instead. What one essentially is doing is this: he is removing his protection for the stock, but only below the striking price of that written put, less the put premium. In this case, the striking price (25) less the put premium (6.80) is 19.20. That’s the “breakeven” price for selling that put.
If BP falls below there, the sale of this out-of-themoney put will prove costly. But that price might be so low that the stock owner will consider the trade as an opportunity to sell something expensive against his long collar. That sale doesn’t require any margin or collateral since it merely creates a bear spread – long Jan 40 put and short Jan 25 put – which has no margin requirement.
Figure 3 adds this strategy (the sale of the Jan’12 25 out-of-the-money put) to the previous strategies depicted in Figure 2. It is the red line D. Note that the original collar (line A) and this strategy of selling the out-of-the-money put (line D) cross each other at a price of 19.20 for the stock. In other words, the sale of the out-of-the-money put is superior to the original collar strategy at all stock prices above 19.20. By selling the 25 put, you have removed the protection for the stock below 25 – the stock is trading “on its own” below that price. But since you took in 6.80 for that sale, you haven’t given anything away visa- vis the original collar, until the stock falls below 19.20.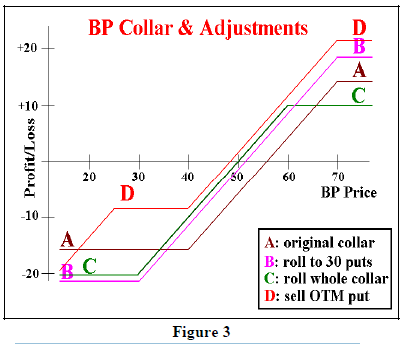
This article does not address the strategies of originally establishing a collar. Those were described in the previous articles cited earlier. However, I want to point out one thing here: I do not like the strategy of placing a put spread in place when the collar is initially established. That is because you then only have protection between the striking prices of the put spread.
However, creating a put spread after the stock has already fallen is a different strategy. By the time the stock has dropped as far as it has, you have a better feeling for any further risk. It is also quite likely that the implied volatility of the put you are going to sell is massively inflated after the stock has dropped sharply.
Perhaps nothing illustrates this case better than recent activity in Walgreen (WAG). We also had collars in place for clients in that stock, where the long puts were the Jan’12 30's. WAG has struggled recently and has been trading slightly below 30.
This week, a huge buyer of the Jan’12 30 calls has shown up. He has bought 25,000 calls or so (take a look at the open interest of the Jan’12 series of options), paying an inflated vol of 35% or so (near-term WAG options trade with vols in the low 20's). Via arbitrage, all of Jan’12 options are now expensive. For example, the Jan 22.5 puts are bid with an implied vol of 39.8% currently, and the Jan 25 puts are bid at 38.2% vol. Thus, a collar “owner” could sell either of those out-of-the-money puts against his initial position. He might even plan to cover if Jan’12 implied vols return to a more normal vol.
In summary, when one establishes a collar and the stock subsequently falls in price, there are a number of things that one might do – and one probably should utilize them rather than sitting and doing nothing.
This article was originally published in The Option Strategist Newsletter Volume 19, No. 15 on August 13, 2010.

© 2023 The Option Strategist | McMillan Analysis Corporation