
By Lawrence G. McMillan
This article was originally published in The Option Strategist Newsletter Volume 14, No. 17 on September 9, 2005.
In our last issue, we discussed the general concepts of leverage: trading stocks on margin, trading futures, and options – either long or naked. The most important point that was made is that leverage is neither inherently good nor bad, for it is within your control. If you want less of it, then boost your investment to reduce the leverage; if you want the maximum amount of it, fine – but be aware of the increased risk and reward percentages that accompany high leverage.
In this article, we are going to take a look at how leverage can be used in a specific strategy – covered call writing – to virtually change the way the strategy behaves. Most traders would agree that covered call writing is a conservative strategy. That may or not be the case, as we will see. In fact, covered call writing gets its “conservative” label from brokerage firms and exchanges, who have espoused its use in a low-risk manner. Covered call writing has less risk than owning stock, since the option premium received – no matter how small – reduces downside risk as compared to stock ownership. For most people, that fact alone is enough to earn the “conservative” tag.
However, in any option strategy, we can utilize the fact that equivalent positions can be constructed. Some of those strategies – while still having the same profit and loss potential in dollars as a covered call write – involve the use of leverage. That leverage can be quite large, as we shall see. In the examples in this article, we will make the assumption that one is creating a new covered call position (or its equivalent) – not writing calls against stock already owned.
Covered Call Writing Using Cash
The most conservative approach for covered call writers is to buy stock for cash (i.e., to fully pay for it) and to sell calls against it. In order that we might have some comparisons between different approaches, let’s go through the motions of calculating the returns of a sample covered call write. For those not familiar with the strategy, this might be useful as an educational exercise as well.
Example: Suppose XYZ is trading at 43 and we buy 100 shares and sell the March 45 call – expiring in exactly six months – for 3 points. Commissions will be ignored in this example. Furthermore, assume that there will be no dividend payments during the life of this covered call write. Our pertinent returns are:
     Investment required: $4000
     Profit if exercised: $500
     Raw Return if Exercised: 500/4000 = 12.5%
     Annualized Return if Exercised: 25% (six month
         holding period).
     Profit if unchanged: $300
     Raw Return if Unchanged: 300/4000 = 7.5%
     Annualized Return if Unchanged: 15.0%
We could also make some computations about downside risk. Our breakeven point on the downside is 40, but percentage downside protection (7%) is not really a meaningful number, because we don’t know how volatile this stock is. The implied volatility of this option is a little over 29%, so this stock is modestly volatile (about 3 times as volatile as the S&P 500, in today’s terms). Assuming that’s a good estimate of the stock’s volatility, we can calculate that the probability of the stock being below 40, using our new software – Probability Calculator 2006 – as about 40%. So there is a large probability of losing money on this trade. However, maybe we like this stock, or there is technical support at 40 – factors other than pure probability which would entice us to enter into this position.
Covered Call Writing on Margin
The simplest way to use margin in a covered call write is to buy the stock on margin. The margin rules for covered call writing are quite favorable to the writer (if you don’t mind the leverage), for they may allow you to increase your returns by a factor of more than 2-to-1, which is what the stock buyer on margin is able to attain. The reasons for this potentially larger leverage factor in covered call writing is that the broker will lend you the appropriate amount (more about that in a minute) and then the proceeds from the call write are applied, thereby reducing the amount of investment that you, as the investor, must make.
The broker will lend you 50% of the striking price or of the stock price, whichever is lower. This requirement keeps you from writing deeply in the money calls without having to put up any money at all. Nevertheless, one can increase his leverage quite a bit just by simple covered call writing.
First, let’s look at the same example as in the last section – a covered call write of the March 45 calls, trading at 3, with the underlying XYZ stock selling at 43:
Example: buy stock at 43, on margin, and sell the March 45 call (which has 6 months remaining until expiration), at 3. Assume no commission expense and no dividends, but assume a margin interest rate of 10%. That is, the broker will lend you money, but he charges interest on the loan at the rate of 10% annually (or 5% for this 6-month holding period).
  Broker’s Loan: 50% x 43 (min. of 43, the stock price,
     and 45, the strike) = $2150
  Margin interest to be paid for 6 months: 10% x $2150 x
     0.5 years = $107.50
  Your Investment required: 50% x 43 less the premium
     = $2150 – $300 = $1850
  Profit if exercised: $500 – interest = $500 – $107.5 =
     $392.50
  Raw Return if Exercised: 392.50/1850 = 21.2%
  Annualized Return if Exercised: 42.4% (six month
     holding period).
  Profit if unchanged: $300 – interest = $192.50
  Raw Return if Unchanged: 192.50/1850 = 10.4%
  Annualized Return if Unchanged: 20.8%
The downside breakeven point is now 40 plus the per-share argin expense of 1.075 points – making the effective ownside breakeven point 41.075. The probability of the stock being below 41.075 at expiration is about 44% – reflecting the slightly greater risk of establishing the write on margin.
In the last issue, we calculated a leverage factor by comparing the returns in the leveraged situation with those of the non-leveraged situations. In the case of this covered write, we would have the following leverage factors.
Profit       Cash   Margin  Leverage Factor
Rtn if Exer  12.5%  21.2%      1.70 : 1
Rtn if Unch  7.5%   10.4%      1.39 : 1
So, in this simple covered write, the leverage factor is not as great as the 2:1 that one could attain by buying stock on margin and comparing it to a simple cash purchase of stock. The reason is that the margin interest of $107.5 per share during the six-month holding period is large in comparison to the available returns – and hence that expense reduced the leverage potential in the profit column.
Even so, these leverage factors do not tell the whole story, because there is risk to the downside. In fact, if the stock were to fall to zero, the cash covered writer would lose 100% of his $4000 investment, but the covered call writer on margin would lose $4107.50 and his investment was only $1850 – a loss of 222%, a leverage factor of 2.22 : 1.
The leverage factor will be different at various stock prices for this sample covered write. Note that the leverage is greater on the downside, when losing, than it is on the upside, where profits exist. This is because – on margin – you are risking the entire loan of $2150, plus the margin interest, in addition to your own investment of $1850.
Using An Equivalent Strategy
With options, there is often more than one way to construct a position – yet keep the dollars of profit and loss essentially the same. When one does that, the two positions are said to be equivalent. In the case of covered call writing, the equivalent position is really quite simple: it is the sale of a naked put. Both a covered call write and the sale of a naked put have a profit graph with the same shape -- a limited profit potential above the strike and large downside risk. When two strategies produce a profit graph with the same shape, they are said to be equivalent. Their investments, and hence return on investment, may be quite different, but their profit and loss potential are the same.
It should not come as news to the covered call writer that the sale of naked puts is an equivalent strategy. In fact, many call writers have forsaken the simple strategy to become naked put writers, for the returns are larger – through leverage. But as in all leveraged investments, the risk is increased (in percentage terms) as well.
Let’s return to the same example, with a few simplifying assumptions.
Example: assume the following prices exist:
        XYZ: 43
        March 45 call: 3
        March 45 put: 4.15
You might think that the put would be trading at 5 – and if it were a futures option it would – but stock options must reflect the cost to carry of the striking price. In other words, if the market maker set up a risk-free arbitrage (long stock, long put, short call), the prices would be as shown, in order to reflect the fact that the arb would have to carry the $45 investment for 6 months, until expiration. For further information on this calculation, see the box on page 7.
Before calculating returns, it is necessary to quantify the investment that would be required. The exchange minimum margin requirements for writing a naked put are as follows:
Margin: 30% of stock price less any out-of-themoney amount plus the option premium with the stipulation that the requirement is at least 10% of the stock price. So the initial margin requirement for this March 45 put write would be: 30% x 43 + 415 = $1705 (no allowance for outof- the-money, since the put is initially in the money to begin with)
In other words, the investment changes as the stock price changes. This is what often makes it difficult to compare naked option writing with other strategies. The following table shows some of the data points that might be pertinent, for the sale of the Mar 45 put, at expiration:
Stock Price  Put Margin     Profit
             (---at expiration---)
    60        $600          +$415
    50        $1000         +$415
    45        $1350         +$415
    43        $1490         +$215
    40        $1700          –$85
    35        $2050         –$585
The appropriate returns could then be computed as the profit divided by the naked put margin, for each stock price: 69% at 60, 41.5% at 50, ...down to –29.25% at 35.
Of course, one might say that the profits should be divided by the initial margin ($1705), which would produce different percentage returns.
One way that experienced traders often approach this problem of defining the investment is to calculate the expected investment based on the volatility of the stock price. That is, we can calculate the probability of being at a certain stock price, and we know the naked put margin requirement if the stock is there, so if we multiply those two – for each stock price – and sum over the entire spectrum of possible stock prices, then we can calculate the expected investment. Of course, that assumes one would not make adjustments prior to expiration – an unrealistic assumption for real-life trading of naked put options.
So, there is some contention over just how much leverage a naked put writer acquires – in comparison to the “normal” covered call writer. No matter how it’s computed, leverage factors of about 2-to-1 can easily apply – especially if we account for the fact that margin requirements can vary with the stock price.
In any case, it should always be remembered that the covered-writer-turned-naked-put-writer can always reduce the leverage by allocating a larger investment amount to the strategy – say, the margin where he plans to take defensive action. In the above example, if one were to figure on taking defensive action at a price of 40, he would allow margin of at least $1700 (30% of 40, plus the 5 points that the option would be in-the-money).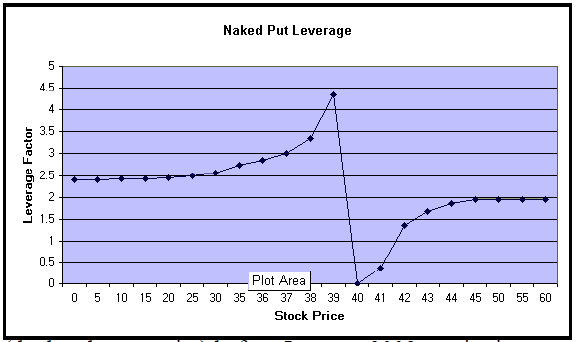
The graph above shows the leverage factors for this sample naked March 45 put write as compared to a cash covered write of the March 45 call, assuming that $1700 is considered to be the investment (that’s a convenient assumption, since it’s very close to both the initial margin and the margin if defensive action were to be taken, with the stock near 40). As with the graphs shown last week, there is some discontinuity near the initial stock price (40, in this case) since that is the breakeven point of the cash covered write. Away from there, though, you can see that the leverage factor is 2:1 or larger.
Infinite Leverage In A Covered Call Write
Ironically, due to the way that margin requirements are computed, it is sometimes possible to construct a covered call write on margin that has infinite leverage! Consider the following example:
Example: XYZ: 28
  Jan (‘08) LEAPS 30 call: 15
You won’t often find a pricing structure like that, but they do occasionally exist. In this example, the implied volatility of the Jan LEAPS call would be 94% – high, but not unheard of. The initial margin required for a covered call write of the Jan 30 LEAPS would be:
  Stock margin (50% of 28): $1400
  Less Option Premium:     –$1500
  Margin Required:         –$100!
In other words, you do not have to put up any of your own money to do this trade. That is infinite leverage. Before you rush to look for these situations, recognize the fact that leverage works both ways. If this stock were to drop below 13 (the breakeven point) before January, 2008, expiration, you would have a loss – and a negative infinite rate of return.
The Northwest Air (NWAC) Jan (‘08) 2.5 covered write that we recently recommended was a trade of this type: very low investment, and thus very high leverage. We bought NWAC at 5.50 and sold the Jan (‘08) 2.5 call for 3.90. If bought on margin, your stock requirement would be 4.25 points (the stock cost of 5.50, less half the striking – 1.25 – which is all the broker would loan you in this case), less the 3.90 option premium – or a very low 0.35 points. Despite the high returns available, we only took a limited position, however, since there is bankruptcy risk here. Hence we only bought 1000 shares – risking a little more than $1700, which is commensurate with the risks that we take in most of our positions. Hence, we control the leverage by assessing the risk and taking an appropriately-sized position.
In summary, the simple covered call writing strategy can be tailored – via leverage – to be capable of generating higher risk and reward. Thus, even less conservative investors can utilize this strategy to their advantage.
This article was originally published in The Option Strategist Newsletter Volume 14, No. 17 on September 9, 2005.

© 2023 The Option Strategist | McMillan Analysis Corporation