
By Lawrence G. McMillan
This article was originally published in The Option Strategist Newsletter Volume 19, No. 17 on September 17, 2010.
One of the main problems with commodity-based ETF’s is that they don’t necessarily track the underlying commodity very well. This is mainly due to the fact that the ETF is forced to trade the futures contracts, and there are times when it isn’t feasible for the ETF managers to roll from one futures contract to the next without making a “losing” trade that puts “drag” on the performance of the ETF vis-a-vis the spot index or commodity itself.
There have been many articles written about the US Oil Fund ETF (USO) and/or the US Natural Gas Fund ETF (UNG) as they compare to actual Crude Oil or Natural Gas prices, respectively. These funds buy the actual commodity futures, rolling them forward when they expire. The “problem” arises from the fact that – when the longer-term contracts are more expensive than the near-term contracts – the ETF pays the differential.
Example: the front-month Crude Oil futures are expiring, and thus are near the spot/cash price at expiration. Let’s assume that price is 75. The USO ETF sells out their position in the front month futures, and buys the next month out – at a price of 76.50, say.
A month later, assume that the cash market is still unchanged at 75. The now-expiring futures which cost 76.50 are now trading at 75. So the ETF has a loss of 1.50 on these contracts, even though the spot/cash market is unchanged.
Over time, the cumulative effect of all these rolls forward into futures trading at higher prices puts a “drag” on the performance of the fund, with respect to the cash market. Furthermore, the ETF only has a limited amount of assets, and eventually, these losses could actually cause the ETF to theoretically run out of cash.
This same problem affects the Volatility Index ETN’s, VXX and VXZ. VXX utilizes the front two $VIX futures contracts, while VXZ utilizes months 4 through 7. Each day, the weighting of the various contracts changes, to reflect the proper ratio of the futures.
Consider the VXX ETN. The September $VIX futures just expired, so the VXX consists of being long both the October and November $VIX futures. With 19 trading days (four weeks) to go, the ratio might be 95% October and 5% November. Then tomorrow, 90%/10%, and the day after 85%/15%, and so forth. Each day, at the close, the managers of the ETN (Barclay’s Bank) sell some October futures and buy some November futures.
When the term structure of the $VIX futures is positive, the Novembers are more expensive than the Octobers (not to mention the fact that the market makers know these orders are coming into the pit, and thus there is a certain additional “cost” to Barclay’s to execute trades in a market where your trades are known in advance).
However, sometimes the term structure slopes downward and the ETN actually makes money on the roll because the second month is lower-priced than the front month. This typically happens in a bearish market.
Several charts follow, to illustrate these concepts. Let’s begin with the simple charts of VXX and $VIX, as shown in Figure 1. Even without statistical verification, one can see that VXX has performed far worse than $VIX itself. Consider points A and B – which represent the $VIX peaks of March 2009 and May 2010, respectively. In terms of $VIX, point B was nearly as high as point A. But in terms of VXX, point B is far below point A.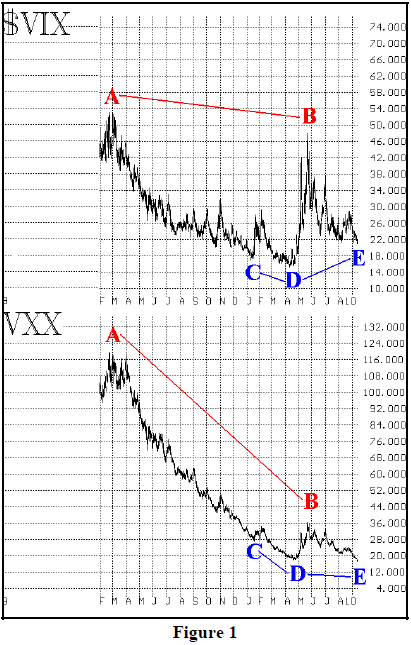
The term structure of the $VIX futures has been positive almost continuously since the March 2009 bottom. As a result, the daily rolls that VXX must perform have been costing money. The net effect is the poor performance of VXX vis-a-vis $VIX.
Points C, D, and E further strengthen the case. From point C to D, VXX performed nearly in-line with $VIX. If you’ll recall, the term structure was very flat during this time period, so the “drag” on VXX was minimal. From point D to B, the stock market fell, and VXX actually gained ground – more about that later. But as the summer has worn on, the premiums on $VIX futures have grown huge, and the term structure has steepened considerably – both of which hurt VXX performance. So, by point E, VXX is at new lows, even though $VIX is not.
Relative Performance
The above charts are illustrative, but don’t really make the proper comparison, because one is just comparing absolute values of the two, $VIX and VXX, with the naked eye. For example, it’s almost impossible to see where VXX outperforms $VIX (we know that it does, sometimes). So, a statistical comparison would be more relevant.
This is achieved by dividing the two price series, day by day. The results are shown in Figure 2 (below). When this chart is rising, $VIX is outperforming VXX, and when it is falling, the opposite is true.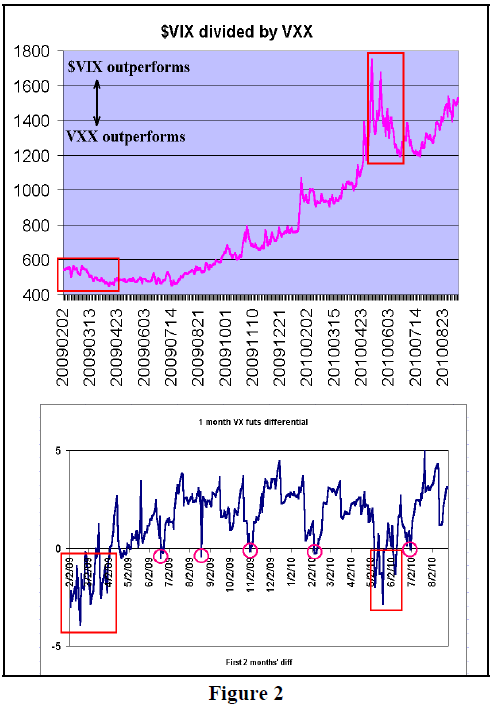
There are actually two charts in Figure 2. The top chart is the afore-mentioned division of $VIX by VXX. The lower chart is the daily spread between the front two months of the $VIX futures. In other words, this is the cost of the “roll” that VXX managers must make daily, according to the terms of the ETN.
The top chart verifies what we observed from Figure 1: $VIX has outperformed VXX substantially over the course of the life of VXX (which was first traded on January 31, 2009). The general rising trend of the top chart shows the $VIX outperformance quite clearly.
However, $VIX has not outperformed VXX at all times. In particular, the two red rectangles (on both the upper and lower charts) depict periods where VXX outperformed $VIX. The reason that it did is clear from the lower chart – those were times when the term structure was negative (sloping downward) – and so the daily roll of contracts from the front month to the next month actually occurred at a “credit” to VXX.
Even at the times when the differential was zero, VXX had short periods of outperformance. Those are denoted by the circles on the lower chart. Note that the circled date itself wasn’t so significant, but for a period of time surrounding the circle (especially the last three, since November, 2009), there was outperformance by VXX. This has to do with the fact that the entire VXX position is not rolled every day – only a part of it – and depending on the assets of the fund, the daily weights of the rolls are not uniform, either.
In any case, the overall point is that VXX outperforms when the term structure slopes downward (which only happens in bearish times or when $VIX is at very high levels), while VXX under-performs when the term structure slopes upward (which is common during bullish times). Moreover, at times such as the present, where there is great demand for protection from $SPX put buyers, the term structure slopes upward even more steeply, thus putting an even greater “drag” on VXX.
What’s The Alternative?
Many institutions (mutual funds, say) are not able to trade futures and/or options, or don’t want to. If such an entity wants to trade volatility, it is likely that they are using VXX. But, for those without restrictions, one can trade volatility by using $VIX futures, $VIX options, and/or VXX options. Let’s set options aside for the moment, since this discussion is a comparison of the performance of $VIX to instruments that simulate $VIX.
So, are $VIX futures a better (or worse) way to trade volatility, as compared to VXX? Suppose one wanted to maintain a long position in volatility at all times, using the $VIX near-term futures contract. That means he would hold the contract until near expiration, and then roll it out to the next expiration month. This process would be repeated monthly. In effect, this futures trader would be creating the continuous $VIX futures contract. A chart of the front-month continuous $VIX futures is shown in Figure 3, dating back two years, so the high volatility of 2008 is included.
In essence, the futures trader’s actions are very similar to what the VXX ETN managers are doing. However, VXX is rolled daily, a small percentage at a time, while the futures trader would roll his whole position once per month. Still, if the term structure is sloped upward when he has to roll, the futures trader faces similar problems to the VXX trader (and similar benefits if the term structure is negative).
So, comparing Figures 1 and 3 we see that the futures continuous chart falls somewhere between $VIX and VXX in terms of performance. This can be verified by comparing the relative highs of May 2010 with the March 2009 levels, as well as recent lows. One big difference is that the futures trader only has the “friction” of trading once per month, while VXX has it daily.
As was the case with VXX, it is better to compare $VIX with the continuous futures by dividing the two. That result in shown in Figure 4. Two time periods are shown in this chart. The top period dates from early 2007 until now, while the bottom chart encompasses the same time period as those in Figures 1 and 2 – dating from the inception of the VXX contracts (1/31/2009).
The top chart in Figure 4 shows that – over the longer time period – the continuous futures contract has held its own against $VIX quite well. In fact, there was a long period during which the futures did better, from about October 2008 until May 2009. There were some substantial futures discounts (to $VIX) when the monthly rolls were made during that time period.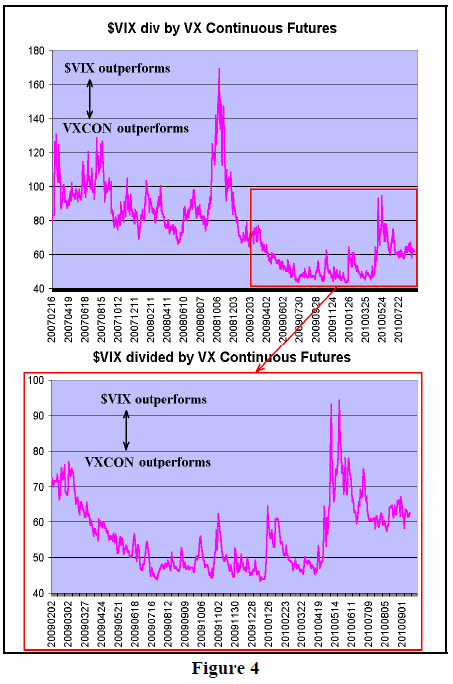
The lower chart in Figure 4 shows just the time period since February 2009. The rectangle on the top chart is “zoomed in” to make the lower chart. This is substantially different from the lower graph in Figure 2, where $VIX clearly outperformed VXX. The comparison of the upper graph in Figures 2 and the lower graph in Figure 4 shows quite clearly that the continuous futures roll is a much better approximation of $VIX than VXX is.
It’s somewhat surprising to see the continuous futures trade being so much better than VXX. A quick check of some prices verifies the data, though. Note that $VIX dropped from about 29 to 16 from September 2009 through April 2010 (a decline of 45%). The adjusted continuous futures contract dropped from 55 to 33 over that time (a decline of 40%). So, even when the chart in Figure 3 seems to be doing worse (to the naked eye), it is actually doing slightly better in percentage terms.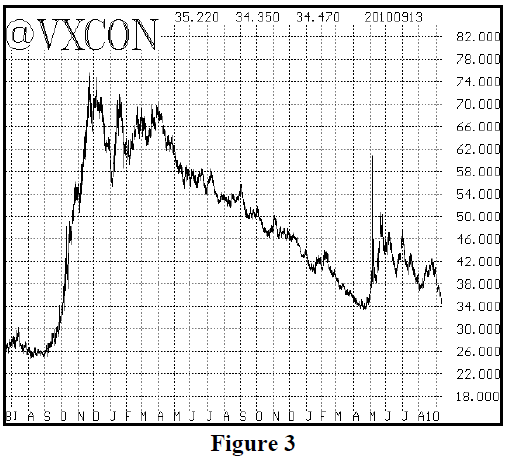
Certainly some of the better continuous futures performance is due to the “luck” of the prices when rolled just once per month, as opposed to rolling a small percent of the VXX position every day. Even so, that can’t account for all of it.
Conclusion
I’m not sure anyone really buys VXX and just holds it, but VXX can be a useful tool, despite the fact that it underperforms $VIX in bullish times. Note that VXX outperforms in a bearish market, so that’s when you’d want to be long VXX. Meanwhile, since VXX underperforms during a bullish market period, that’s when you’d want to be short VXX. Options traders can improve on that performance, or at least reduce risk, by using equivalent positions.
One could make these decisions (to be long or short), based on the term structure of the $VIX futures (be long VXX when futures are at a discount to $VIX, and be short VXX when futures are at a premium).
So, contrary to the negativism about commodity ETF’s (of which this is one), there are ways that VXX can be gainfully used.
But if you just want to speculate on volatility, the $VIX futures appear to be superior to VXX.
This article was originally published in The Option Strategist Newsletter Volume 19, No. 17 on September 17, 2010.

© 2023 The Option Strategist | McMillan Analysis Corporation