
By Lawrence G. McMillan
This article was originally published in The Option Strategist Newsletter Volume 16, No. 13 on July 13, 2007.
In this newsletter, over the years we have presented many methods for protecting a portfolio of stocks. Some are “ancient,” such as buying S&P 500 Index ($SPX) puts and some are “new,” such as buying $VIX calls. With the continuation of the bull market well into its fourth year (making it the fifth longest bull market in history – but not the fifth largest), many portfolio managers and individual investors are becoming concerned that a sharp correction may be more than just a remote possibility. As such, the topic of protecting a portfolio with derivatives has once again risen to the forefront. With that in mind, I wrote The Striking Price column in Barron’s this week, on this topic.
Accordingly, McMillan Analysis Corp. (MAC) has just published a full research report on the topic. This article is an excerpt from that publication. If you would like to receive the full report, please send us an email requesting it, to info@optionstrategist.com. All we ask is that you mention that MAC is a consultant and/or money manager in these strategies, if you decide to implement any of them for your accounts or accounts you advise, or if you pass this information on to others. There are many ways that a portfolio can be protected. One can take a “macro” approach and use broad-based index options to hedge broad market risk. This approach is usually the most efficient in terms of cost, but might not work well if the portfolio doesn’t track the index well.
The “micro” approach is more work. It generally involves hedging individual stocks with options. This approach gives the best hedge, of course, since the hedging vehicles pertain exactly to the individual stocks. However, it can be quite costly, both in terms of “insurance dollars” and in terms of time spent managing the positions.
“Macro” Approaches
- Buying broad-based, out-of-the money index puts. This is probably the most popular form of protection using broad-based index options (that doesn’t necessarily mean it’s the best form of protection).
- Broad-based index Put Spreads. Some managers will buy out-of-the-money puts, but then will also sell puts that are even farther out of the money in order to bring in some dollars to reduce the cost of the insurance. The risk in using this strategy is that one puts a “cap” on his protection.
- Selling broad-based index calls. This is not a particularly popular strategy among those needing or wanting “disaster” insurance, but it is popular among managers who feel that the sale of a wasting asset (a call option) will provide superior returns if applied continuously over long market cycles.
- Collars. This strategy combines numbers 1) and 3) above: it is the purchase of an out-of-the-money put and the sale of an out-of-the-money call. The sale of the call reduces the cost of the put – thereby reducing the cost of insurance overall. That reduces the cash cost of the insurance in exchange for opportunity costs in potential lost profits on the upside.
- Futures: One could conceivably sell broad-based index futures against his stock portfolio. This approach is generally not very popular because this was the strategy that was widely blamed for the Crash of ‘87, and thus has a negative aura.
- Volatility Derivatives: Volatility generally rises when the market falls. So, as a portfolio hedge, one would buy volatility futures – or, preferably – call options on volatility.
Volatility Derivatives
Volatility and variance futures were listed by the then newly-created CBOE Futures Exchange (CFE), and options began trading on $VIX – as a cash-based index product on the CBOE, similar to $OEX or $SPX – in late February of 2006.
The introduction of these new vehicles paved the way for a new class of portfolio protection – protection against a sharp increase in volatility. When the stock market drops, volatility increases – often dramatically. So, as a means of protecting a portfolio, one could either buy volatility futures or buy call options on volatility.
Shortly before the volatility futures were listed, an analysis performed by Merrill Lynch showed that a 10% volatility hedge was sufficient to protect a broad-based stock portfolio. In other words, if 90% of the assets were invested in stocks that behaved similar to $SPX and 10% were invested in “$VIX,” the resulting portfolio outperformed $SPX in both bull and bear markets. In actual practice, this theory proved to be unworkable due mainly to the high premium cost of buying $VIX futures, but the principle is valuable, if only to show that a 10% hedge is the proper one.
Why Are $VIX Calls A Better Hedge Than $SPX Puts?
The simple reason that $VIX calls are a better hedge for a broad-based equity portfolio is that they provide dynamic protection, whereas $SPX puts do not. To demonstrate this, consider the following examples:
Example: in June, with $SPX at 1530, a portfolio manager decides that he wants to hedge with $SPX puts. He chooses the Dec 1400 puts – 8% out of the money. After the protection is purchased, the stock market has a strong summer rally. By early September, $SPX has reached 1700. The puts that he bought for protection are now 300 points out of the money at perhaps the time they are most needed – entering the fall of the year (traditionally a rough time for stocks). The problem is that the put strike was fixed and, when the market rose, the protection became less and less valuable. At this point, one would have to either buy more protection at a more reasonable distance out of the money (8% - 10%) or forsake the protection altogether.
The same thing does not occur with $VIX options. Consider the same portfolio manager, but now he decides to buy $VIX call options as protection.
Example: in June, with $SPX at 1530, and with $VIX trading near 12, a portfolio manager decides to buy $VIX calls as a hedge. He chooses the December 18 calls. That is, they will provide protection if $VIX climbs above 18. This is likely only to happen in a sharp market decline, but $VIX normally spikes into the mid-20's and higher during a sharp market decline – even when it starts from such a low level.
As in the previous example, $SPX rallies throughout the summer, reaching 1700 by early September. At that time, $VIX is likely to be trading ... near 12! That is, $VIX won’t decline much, if at all, during the summer rally. Thus, in this case the portfolio protection is still as viable as it was originally. If the market drops sharply, $VIX will shoot up into the 20's and the $VIX long calls will provide protection.
This example shows how $VIX calls are dynamic protection. They don’t lose their protective ability when the broad market rallies. This is especially true when $VIX is relatively low to begin with – below 15, for example.
Implementing Macro Protection
The equity portfolio manager is most concerned with the cost of his protection. It will vary according to market conditions. If volatility is high – particularly during an already-declining market – $SPX puts and $VIX calls will be more expensive.
In order to estimate the cost of this protection, some simulations were run – using actual prices. The net cost of the protection was then estimated.
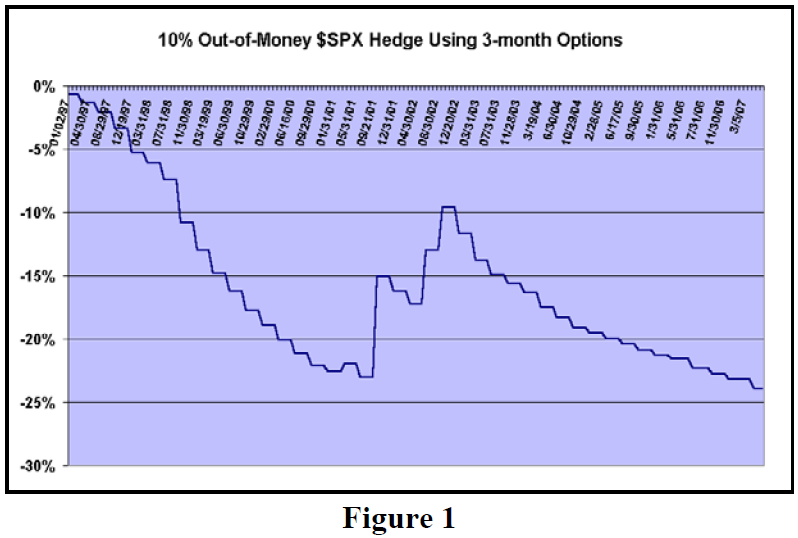
As an example, Figure 1 shows the net cost of buying 3-month $SPX puts 10% out of the money. Furthermore, it was assumed that the protection was held all the way to expiration – collecting the intrinsic value if the put expired in the money, or expiring worthless otherwise. Then, a new 3-month put, 10% out of the money was bought. This was done each quarter – using actual $SPX put prices.
The data in Figure 1 began in January 1997, so it encompasses a full 10-year period. This graph shows only the cost of protection, expressed as a cumulative percentage of the price of $SPX (left scale). In other words, on the far right-hand side of Figure 1, note that the graph is at about minus 24 percent. In other words, the cumulative cost of the protection over the 10+ years was 24% of the $SPX value (or, 24% of the portfolio value, if you prefer). On average, that’s a little more than 2% annual cost for the protection.
Note that the protection worked in the middle of the chart – during the bear market of 2001 and 2002. The graph rises during that period, indicating that the puts were making money in many of the quarters. However, prior to as well as after that period, the protection lost money in nearly every quarter. Note the downward stair step pattern of the graph outside of the 2001-2002 time frame. That indicates monthly losses on the protective puts.
Buying $VIX Calls As Protection
If the equity portfolio manager desires to use $VIX calls as protection, he must decide on two things: 1) how far out of the money should the protection be?, and 2) how much protection to buy?
We rely upon the original Merrill Lynch study for this answer – preferring to buy enough $VIX calls to hedge 10% of the portfolio’s value.
Example: as in the previous example, suppose $SPX is trading at 1530 and $VIX is at 12. The hedger decides to buy the $VIX Dec 18 calls. Suppose he has a portfolio worth $10 million. He would want to buy protection equal to $1 million (10%). Since his protection will engage if $VIX is above 18, we use that striking price to determine the quantity of $VIX calls to buy:
Quantity = 10% * NAV / (100 * Strike price)
         = 10% * $10,000,000 / (100 * 18)
         = $1,000,000/1800
         = 555 calls
Assuming that 3-month calls are purchased (for they will track most closely with $VIX), then the cost of these calls can be expected to be 1.00 or less per contract ($100). Hence 555 of them would cost $55,500 – or slightly more than one half of one percent of the portfolio’s NAV.
Suppose that the stock market dropped sharply and $VIX shot up to 25. It is unlikely that the $VIX calls would immediately reflect the full value of being 7 points in the money (due to the term structure of options) – but they might easily be trading at 5. Thus, the profit would be $400 per contract, or $222,000 – 2.2% of the NAV of the portfolio.
Using the above example as a guideline, and using actual $VIX prices and $VIX call prices from the inception of trading in February, 2006, through May, 2007, we can get a small glimpse into what the $VIX calls might cost, as a percentage of NAV of the equity portfolio. This data is summarized below.
Total Cost of $VIX Calls; Feb 2006 - May 2007
Buying $VIX Calls...             Total Result
OOM amount     Initial Life       (15 months)
2 points       3 months            –7.6%
5 points       3 months            –4.7%
8 points       3 months            –2.4%
The best course seems to be to buy $VIX calls that are initially 5 to 8 points out of the money. That cost is a little less than 2.4% annually and is in line with $SPX put costs, but remember that $VIX protection is more dynamic and thus much more in line with the definition of what one normally thinks of as “insurance.”
This article was originally published in The Option Strategist Newsletter Volume 16, No. 13 on July 13, 2007.

© 2023 The Option Strategist | McMillan Analysis Corporation