
By Lawrence G. McMillan
This article was originally published in The Option Strategist Newsletter Volume 21, No. 16 on August 24, 2012.
For quite some time now (perhaps since last November), we have been pointing out how the voracious appetite for volatility protection has had the effect of distorting the term structure of the $VIX futures. Recently, though, this activity has branched out in a way that is only rarely seen in the markets: in short, large institutional traders are both buying stocks and buying volatility ETNs (thus, by inference, they are buying $VIX futures). Hedging on a large scale can distort technical indicators and other things – such as the term structure. That is, we can’t really interpret this activity in a contrary manner. Are these traders bullish (because they’re buying stocks) or bearish (because they’re heavily buying protection)? In truth, it’s probably the former, but their need to buy protection also means they’re not overly bullish. This reminds me very much of what was happening in QQQ options at the end of the tech stock craze in 2000.
A History Lesson From QQQ
In early 2000, at the peak of the tech stock craze, the QQQ Index (NASDAQ-100 ETF) was racing to all-time highs, near 117 – reaching that level in mid-March 2000. See Figure 2 below.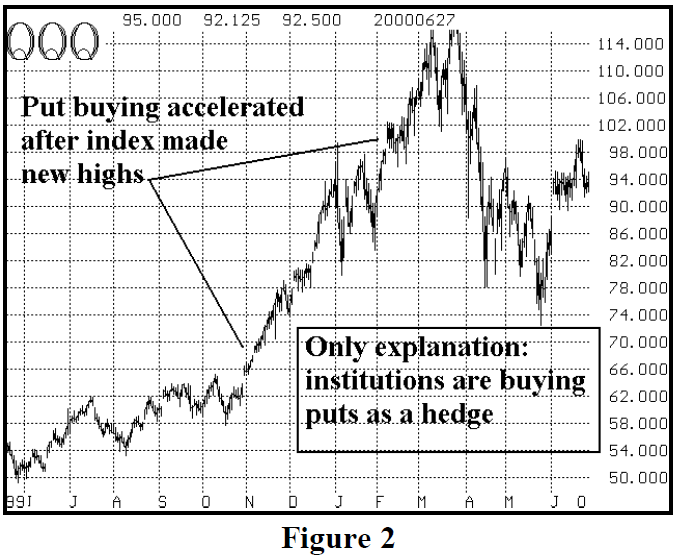
At the same time, the put-call ratio of QQQ was blasting higher as well. It reached 750 in mid-March, 2000 – meaning that 750 puts were trading for every 100 calls traded. That is an extreme put-call ratio, especially for a 21-day moving average. See Figure 1.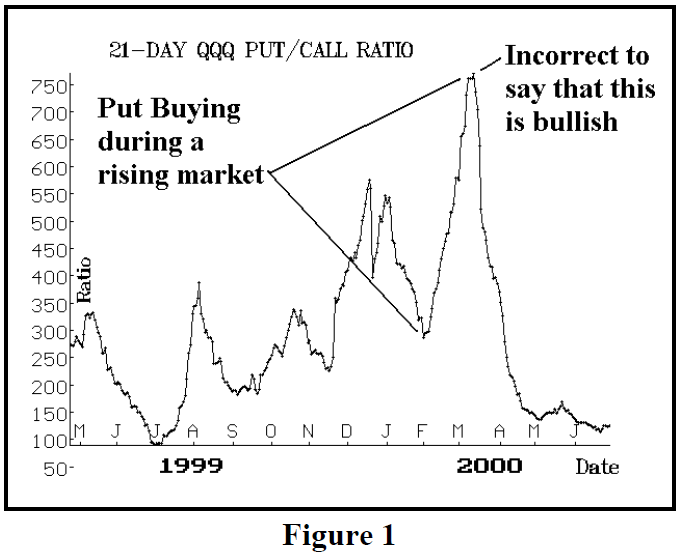
At face value, one might say (and some of our major competitors were indeed saying) that this was bullish for the market. If so many people were buying puts, they must be wrong, and the market must be ready for another rise.
However, something was wrong: the QQQ was rising while all these puts were being bought. This didn’t make any sense. What speculators (whose contrary opinion we seek via put-call ratio charts) would be buying puts when QQQ was making all-time highs? In fact, few were. Rather, there was a massive hedge taking place: institutional investors – who were long wild-acting stocks such as Amazon and Yahoo, that moved 20 or 30 points in a day – were looking to hedge those positions, so they were buying QQQ puts as a cheaper hedge than buying puts on the individual, high-volatility tech stocks.
So, if a trader is buying QQQ and buying puts on QQQ, is he bullish or bearish? We don’t really know. He’s probably bullish, but not overly so. In fact, we have a general rule of thumb when looking at put-call ratios charts that evolved from this exact scenario: in order for a put-call chart to have its traditional contrarian meaning, there must be a clearly inverse relationship between the stock chart and the put-call chart. This was shown in the feature article in our last issue (“Interpreting Put-Call Ratio Charts,” Figures 1 and 2). When that inverse relationship does not exist – as in this QQQ case – we cannot say that the high put-call ratio is bullish for QQQ.
In fact, as it turned out, the tech stocks crashed the next month, when Soros sold out his position en masse, in what became known as the “Tech Stock Massacre” of April 14, 2000. But I contend that the data that was observable in mid-March, 2000, did not predict (nor did it contradict) what was about to happen. Rather, heavy hedging activity can distort an indicator (the 21-day putcall ratio, in this case), and that can effectively render the indicator useless until the hedging activity ceases.
Today’s Volatility Hedge
As subscribers know, we follow the progress of the $VIX futures premium and their term structure. This began to elevate when the stock market bottomed last November, and it has been doing so ever since. I also firmly believe that this pressure on the construct of the $VIX futures (by “construct,” I mean both the futures premium and the term structure) has mainly come from the volatility ETNs that are trading in ever-increasing quantities – particularly VXX and TVIX, and to a lesser extent, VIXY.
At first, the activity was more centered in the volatility derivatives – ETNs and futures. But this most recent rally (since the first of June, 2012) has been marked with heavy buying of both these volatility derivatives and buying of the broad market in many forms – buying of $SPX-like stocks, S&P futures, or SPY (and any other form of large-cap, broad-based stock portfolio buying).
As a result, taking our cue from the QQQ example above, we cannot necessarily glean any predictive value from the steep term structure and the high $VIX futures premium. In “normal” times, these would be bullish indicators, reflecting a positive slope in the term structure that accompanies a bullish environment. Also, when the term structure gets “too steep,” it is normally a warning that the stock market is overbought and needs to undergo at least a short-term correction. At this time, I do not think that we can conclude that either of these “normal” interpretations of the $VIX futures construct is accurate.
That doesn’t mean that we have to sit on our hands and do nothing, though. For as hedged traders of the $VIX futures, we do not care why the futures attain an “overpriced” or “too steep” condition, we merely have to observe it and construct hedge positions to take advantage of it. Our ally in such a hedge is time – for the futures eventually have to converge with $VIX at their expiration date, even though the massive hedging activity may keep them in a distorted condition for longer than one could normally imagine. Let’s look at some data in this regard.
Blended $VIX Futures Premium
We compute the blended $VIX futures premium every day and publish it in The Daily Strategist Newsletter. The blended futures premium price is a weighting – in the same ratio that $VIX uses – of the two nearest-term $VIX futures contracts. Those weighting factors change each day. Figure 3, below, is a chart of that futures premium over the past four years.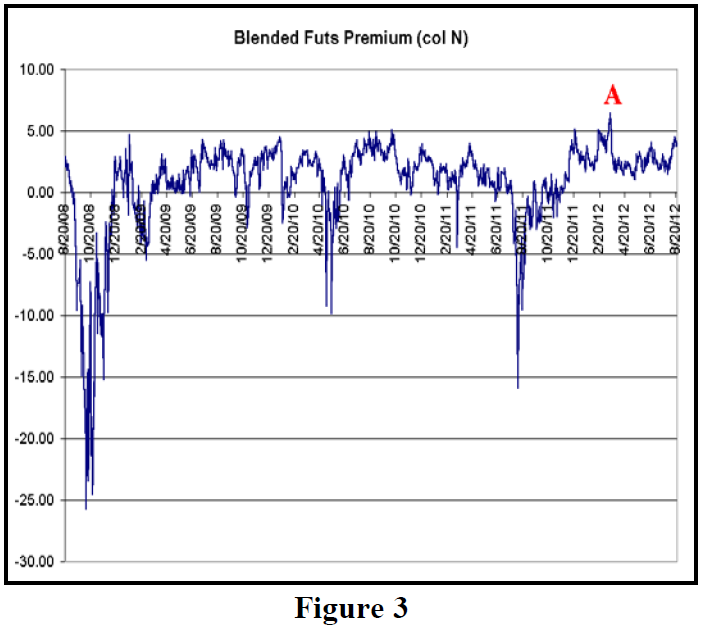
This blended premium level ranges between 0 and 5 most of the time – with a few extreme negative premiums (i.e., discounts) at the various probes downward on the chart – Financial Crisis in the fall of 2008, Flash Crash of 2010, and August 2011 (for which I don’t have a convenient name – what was that, anyway?).
This past week, the blended premium reached 4.47, a fairly rare occurrence. The highest blended premium ever was registered just this past March 16, 2012, at 6.48 (point “A” in Figure 3). $VIX was about 15 at that time, and the futures traded at large premiums, in the low 20's.
Simply stated, when $VIX futures (blended) premium gets to extreme highs, one wants to buy $VIX puts and buy SPY puts – the traditional hedge that we use in such cases. This worked quite well after point “A,” as $SPX more or less traded sideways while the blended futures premium dropped quickly to 1.77 over the next week and a half ($VIX rose slightly, while April $VIX futures plunged).
The profitability of the hedge usually seems to be dependent on the futures premium shrinking quickly – as you can see that it often has, in Figure 3. However, is has not always dropped immediately. For example, just before point “A” the blended premium reached 5, pulled back a little, and then pushed on to point “A.” Any hedges established prior to point “A” were certainly losers, at least for a while.
The current market environment has been difficult for this hedge. What has happened over the past few days is that SPY has risen, while $VIX futures have risen slightly as well. The hedge will never perform well in that case. This unusual action (rising $VIX futures in a rising stock market) is, of course, being fueled by the institutional hedged trade that we detailed earlier – buying stocks and buying “volatility.” While this persists, the $VIX/SPY put hedge will likely mark down. Eventually, of course, expiration will eliminate the premium on the $VIX futures, but one does not like to rely solely on that event, for that may lie too far in the future.
What Can The Institutions Expect?
Are the institutions being smart in overpaying so much for $VIX futures? First of all, some of them may not even realize they are overpaying, for they are assuredly buying VXX, which just looks like an ETN trading at net asset value. The “problem” is that net asset value is computed using the two front-month futures prices, and those are overpriced. Essentially, the long volatility portion of the institutional trade will underperform badly.
It’s somewhat difficult to fully estimate the effect of the institutions’ overpaying for volatility, because we don’t really know how much volatility they are buying per “unit of stock market” that they are also buying. But let’s make an assumption, just to provide a theoretical example. In the somewhat-famous 2003 Merrill Lynch study, the conclusion was that a portfolio that was 90% $SPX and 10% $VIX outperformed $SPX in all markets. A later update to that study changed the percentage to 20%. So let’s assume that the institutional hedge is 90% $SPX and 10% $VIX futures (i.e., we want 9 times as many dollars invested in $SPX than are invested in $VIX). So using current prices, if one “share” of $SPX costs 1410, and one “share” of $VIX costs 15.80, then 9.9 shares of $VIX would be bought for each share of $SPX.
1 share of $SPX = $1410
9.9 shares of $VIX = 9.9 x 15.8 = $156.42
So, the total “portfolio” would have $1410 invested in $SPX (90%) and $156.42 invested in $VIX (10%).
This is a reasonable approximation of what a volatility-adjusted calculation would yield, and it’s much easier to work with.
In order to evaluate the trade, we have to make some assumptions about how far and how fast $SPX will move between now and the $VIX derivatives expiration date. At the current time, the 20-day historical volatility of $SPX is 12%. Meanwhile, the 20-day historical volatility of $VIX is 92%! That’s why we only have to hedge with 10% to 20% of the portfolio’s value.
So let’s assume that the institutional trade is:
Buy 1 “shares” of $SPX @ 1410
Buy 9.9 “shares” of $VIX Sept futures @ 19.25
Furthermore, let’s assume that both $SPX and $VIX move in accordance with their current 20-day historical volatilities (12% and 92%, respectively) through the 17 trading days remaining until $VIX Sept expiration.
Table 1 shows the detailed results of this analysis. First we are looking only at moves from –2 to +2 standard deviations. It is assumed that $VIX moves up 2 standard deviations when $SPX moves down 2, and so forth.
The column “SPX pft” shows the result of owning 1 “share” of $SPX, bought at 1410. The column “VXU pft” shows the result of owning 9.9 “shares” of VXU at expiration (bought at a price of 19.25). The “Tot pft” column shows the total profit of the entire portfolio.
     Table 1: 10% Hedge With Sept VX Futures
Std Devs  $SPX   $VIX   SPX pft  VXU pft  Tot Pft
  -2      1338   23.50   -72      42.1     –29.9
  -1.5    1356   21.28   -54      20.1     –33.9
  -1      1373   19.27   -37       0.2     –36.8
  -0.5    1391   17.45   -19     –17.8     –36.8
   0      1410   15.80    0      –34.2     –34.2
   0.5    1428   14.31    18     –48.9     –30.9
   1      1446   12.95    36     –62.4     –26.4
   1.5    1465   11.73    55     –74.4     –19.4
   2      1484   10.62    74     –85.4     –11.4
The results of Table 1 are somewhat startling. The expensiveness of the hedge is so great that the portfolio loses money throughout the entire range. What is really amazing is how the upside suffers. It should be noted that if a larger (>= +/- 3 standard deviation) move occurred (a real disaster, for example, or a market “melt-up”), then there would be profits overall in either direction. But in the more “normal” market movements – under the assumptions that we made – this is a terrible strategy. It is true that the downside has some protection, but that only helps at –1.5 standard deviation moves or more.
Perhaps a 10% hedge is the problem. Table 2 shows the results (Total Profit column only) of a 15% hedge and a 20% hedge. As you can see, that’s no help either. The downside improves, but at even worse cost to upside profits.
Table 3 is another approach – using longer-term VIX futures as a hedge. Perhaps the high premium in the September $VIX futures is just too costly over a short period of time.
Table 2: 15% or 20% Sept VX Futures Hedge
Std Devs  $SPX  15% VXU  20% VXU
                Tot Pft  Tot Pft
  -2      1338   -5.3     22.8
 -1.5     1356   -22.1    –8.7
  -1      1373   -36.7   –36.6
 -0.5     1391   -47.3   –59.1
   0      1410   -54.2   –76.9
  0.5     1428   -59.6   –92.2
   1      1446   -62.9   –104.5
  1.5     1465   -63.1   –112.7
   2      1484   -61.5   –118.4
In Table 3, we make the assumption that one buys the April 2013 $VIX futures contract today – at a price of 28.2 – in the same share ratio as used in Tables 1 and 2: 9.9 “shares” for a 10% hedge; 15.7 “shares” for a 15% hedge, or 22.3 shares for a 20% hedge.
In Table 3, the time period of the study is now 163 trading days – quite long. $VIX does not move lognormally over that length of time, so I made a couple of assumptions: 1) $VIX wouldn’t go below 10, no matter how far and fast $SPX rises, 2) $VIX would go into the 40's if $SPX fell by 1.5 or 2.0 standard deviations over that time (it probably really wouldn’t get that high, but the trade is already penalized enough as it is).
Table 3: Hedges Using April 2013 VX Futures
Std    $SPX   $VIX   10% VXJ   15% VXJ   20% VXJ
Devs                 Tot Pft   Tot Pft   Tot Pft
-2     1153  45.00   -90.7        6.8     117.6
-1.5   1213  40.00   -80.2      -11.7      66.1
-1     1275  30.82  -109.1      -93.9     -76.6
-0.5   1341  22.07  -129.7     -165.2    -205.7
0      1410  15.80  -122.8     -194.7    -276.5
0.5    1482  11.31   -95.2     -193.2    -304.6
1      1558  10.00   -32.2     -137.7    -257.9
1.5    1638  10.00    47.8      -57.7    -177.9
2      1723  10.00   132.8       27.3     -92.9
These results are pretty poor as well. The hedge produces a profit at –1.0 standard deviations and lower, so that is okay (although net necessarily enough of a profit to counteract the entire $SPX loss). But if $SPX is unchanged or rises less than +2.0 standard deviations, the hedge is a huge drag on the position.
Admittedly, a lot of things could actually happen that might improve these theoretical results, but then again a lot more things could happen to make them worse.
This is just theory, of course, but it points out the folly of this current institutional trade. Merely buying $SPX (or the equivalent) and then buying VXX (which is the equivalent of buying the two front-month futures contracts) is not going to work out well for these traders. But I guess they’re going to have to figure that out for themselves. Overpaying for any derivative is not a good approach, no matter what it is.
This article was originally published in The Option Strategist Newsletter Volume 21, No. 16 on August 24, 2012.

© 2023 The Option Strategist | McMillan Analysis Corporation