
By Lawrence G. McMillan
This article was originally published in The Option Strategist Newsletter Volume 22, No. 17 on September 16, 2013.
In our last issue, the feature article discussed whether it might sometimes be preferable to trade the underlying stock as opposed to buying an at- or slightly in-the-money option. This week’s article is a follow-up to that discussion: we are going to look at various option strategies that are, in effect, almost like owning the underlying stock. The potential advantage of these option strategies is that they behave much like stock so time decay is not a major drag on the position. Moreover, leverage is available through these strategies (not as much leverage as one would have in an option, but decent leverage nonetheless). Leverage is neither good nor bad, but for those who want it, this is a way to achieve it without subjecting a position to onerous time decay.
In the study from the last issue, it was shown that owning the underlying stock instead of owning an at- or just slightly in-the-money call improved results in about half the cases. We postulated that one would not necessarily have to own stock, but we didn’t get specific with what the alternatives might be. Those are to be discussed in this article.
Synthetic Stock
Many types of option trades are equivalent to other option positions, constructed in a slightly different way. Two option positions are equivalent if their profit graphs have the same shape. For example, a covered call write is equivalent to a naked put sale. That’s because the following profit graph (Figure 1) represents both positions: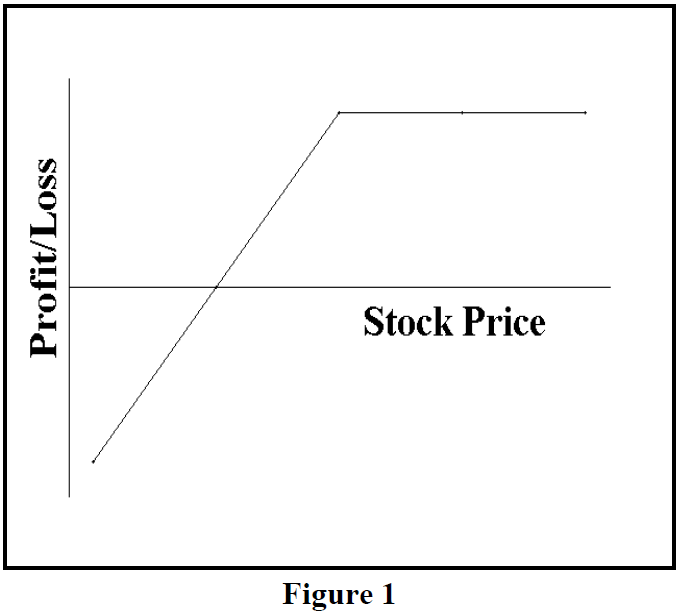
Both the covered call write and naked put sale have a limited upside profit; they also both have large downside risk. Of course, there are many differences – mostly in terms of the amount of money that one has to invest (or collateralize) the position, but also in commission expense, efficiency of execution (one trade for the naked put, two components in the covered write), and so forth. But it’s the shape of the profit graphs that determines equivalency.
So what is equivalent to long stock? It is this:
Long stock  Long 1 call
            and Short 1 put
where both options have the same terms (i.e., the
same striking price and expiration date).

For example, consider the following prices:
IBM: 190.4   Oct 190 call: 4.8   Oct 190 put: 4.40
If one bought 100 shares of IBM, he’d have to
invest $19,040 and his entry price would be 190.4. But if
he used the synthetic, it would look like this:

Buy 1 IBM Oct 90 call 4.80 debit
Sell 1 IBM Oct 90 put 4.40 credit
Net: long 100 shares of “IBM synthetic stock”
      with a strike of 190.
The cost of the option trade is a 0.40 debit, so your effective “buy price” of IBM is the strike, 190, plus the debit, or 190.40 – the same as the stock buyer.1
The option trader would have to margin the naked put. Naked equity put margin (regular customer margin – not portfolio margin) is 20% of the stock price, plus the price of the put, less any out-of-the-money amount. Initially, I would allow this for the synthetic option position:
20% x 190 (strike) x 100 (unit of trading) = $3,800
Plus put price:                                $440
Plus cost of trade (40 cent debit)              $40
          = Total                            $4,280
That is 22.5% of the cash stock investment. Thus this position has nearly 5-to-1 leverage (4.45:1 actually).
As the stock falls, that margin requirement increases. And as the stock rises, that margin requirement decreases. It is akin to owning stock on margin: if the stock falls, your account’s equity is reduced – and vice versa if the stock rises.
The “owner” of synthetic long stock does not want to get assigned on the put, for that would force him into a stock position. So it is often the case that traders will use a striking price that is below the current stock price, so as to reduce the probability of eventually being assigned on the put.
For example, at the same time as the 190 strike prices cited earlier, these prices also existed:
IBM Oct 180 call: 12.00
IBM Oct 180 put: 1.50
So the debit for the synthetic using the Oct 180 put and call would be 10.50 (12.00 – 1.50), meaning that the IBM synthetic is set up at the effective price of the strike plus the debit, or 180 + 10.50 = 190.50. This is very close to the stock price itself. But with this synthetic, IBM would have to fall 10.40 points before there was any chance of assignment at all. If one were a trader, he’d probably stop himself out before the stock fell that far anyway.
No matter which strike you use, you will fully participate in the rises or declines of IBM’s stock price – in a leveraged fashion. Note: one can always reduce leverage by allocating more of his capital to any one trade than the exchange minimum margin requirements dictate.
Example: assume IBM rises to 200 in two
weeks. Further assume that these prices exist:
IBM Oct 190 call: 10.40
IBM Oct 190 put: 0.40
If one were to exit the option trade at this point, he would sell the call that he owns, and he would buy the put that he is short. That would bring in a credit of 10.00. Since he paid a debit of 0.40 to enter the trade his profit is 10.00 – 0.40, or 9.60 ($960).
Since his original margin requirement was $4,280, that’s a return on investment of: $960 / $4,280 = 22.4%
Compared to the 9.60-point, or 5.0% return on a cash investment in the stock itself, the leverage is obvious. Of course, if there were a loss, that would be leveraged up as well.
The above examples assumed that one were trying to take a bullish position in the underlying, but the synthetic position can be used to establish the equivalent of a short sale in the stock as well.
Short stock  Long 1 put
          and Short 1 call
where both options have the same terms (i.e., the
same striking price and expiration date).
Another potential advantage of synthetic stock, is that one doesn’t have to borrow the stock to short it – he merely buys the put and sells the call. Of course, everything is arbitraged eventually, so if the stock is hard to borrow, then there is going to be “time value” in the synthetic short sale. That is, if XYZ is hard to borrow, and it is trading at 40, the Oct 40 synthetic short sale is going to cost a debit – and the harder the stock is to borrow, the larger that debit is going to be.
The synthetic position has no exposure to time decay, for both the put and call decay together (unless, as noted above, one has a synthetic short sale in a stock that is hard to borrow). In that regard, it is superior to holding a long option position. Obviously, in a large upward move, the leverage of owning a single option is going to be much greater than that of the synthetic stock, but most of the time that large move is not in the cards.
Stock Futures
In some cases, single stock futures exist. Most stock traders probably have never traded stock futures. For that matter, most futures traders haven’t traded them either. They have been a rather disappointing product, but they do exist. They would represent another way to be synthetically long or short the stock. The margin required for single stock futures is 20% of the underlying stock price, which is essentially the same as the synthetic option collateral margin. So one might as well use options, and not single stock futures.
Splitting The Strikes
There are ways to “tweak” the synthetic option position to potentially decrease risk or gain other advantages. One of these is to split the strikes for the put and the call in the synthetic position.
Again, return to the IBM example cited earlier. With IBM trading at 190.40, the following prices exist:
IBM Oct 190 call: 4.80
IBM Oct 185 put: 2.50
A synthetic long position – although not one that mirrors the stock exactly – could be created by buying the Oct 190 call and selling the Oct 185 put. That would require a debit of 2.30 points ($230) at the above prices.
The profit graph in Figure 2 shows how a one-lot option position would behave – both at expiration (black line) and prior to expiration (colored lines). The green line is how a purchase of 100 shares of stock would perform.
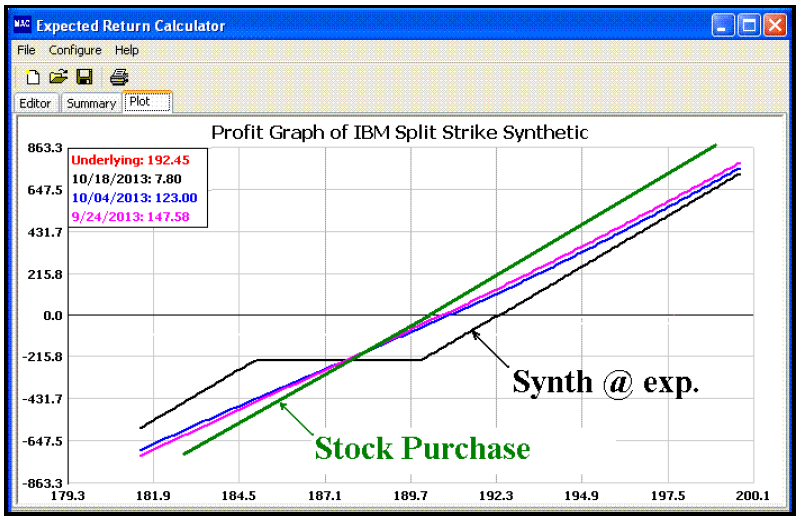
First, concentrate on the black line. Notice that in the profitable area, it underperforms the stock purchase (green) line. The difference is the $230 debit spent for the option position. However, the synthetic doesn’t start to have a large loss unless the stock falls below the striking price of the written put (185 in this case). In fact, in the loss area, the synthetic option position is favorable in comparison to stock ownership, even at larger losses, because of the 5- point “hiatus” in losses (the difference in the strikes).
What is perhaps more important, though, is the shape of the colored lines. These lines (as noted in the box on the upper left of Figure 2) represent performance on Sept 24th and Oct 4th. They perform more like stock.
What the split-strike synthetic offers is a lessening of risk (as compared to the “full” synthetic), but the cost of lessening the risk is the expenditure of some time value premium. That expense is still less than the time value premium of owning the option by itself.
Other Considerations
One way to think of the synthetic position is that one is buying a call – as he normally would in a speculative position – but is eliminating some or all of the time decay risk by selling a naked put at the same time.
However, many small traders do not have the funds to collateralize a position with a naked option in it – especially if the stock is high-priced, such as IBM, GOOG, PCLN, etc. In such cases, it is possible to offset part of the cost of the call with a put credit spread. A put credit spread on an expensive stock is going to require far less collateral than a naked put would.
We recommended a position of this type on last week’s Hotline. As an example, let’s continue with the IBM data that we have been using.
Example: suppose the following prices exist:
IBM: 190.40
IBM Oct 190 call: 4.80
IBM Oct 185 put: 2.50
IBM Oct 175 put: 0.80

A type of synthetic long position can be
constructed as follows.

Buy IBM Oct 190 call
Sell IBM Oct 185 put
Buy IBM Oct 175 put:
Total cost: 4.80 – 2.50 + 0.80 = 310 ($310)

This position does not contain a naked put, so
that the collateral requirement is:
Difference in put strikes + cost of position
= $1,000 (10 points) + $310
= $1,310
The profit graph of this position is shown in Figure 3. The black line describes the position at October expiration. You can see that it has a sort of stair-step feature: on the far left, the maximum loss ($1,310 – the collateral requirement) is shown. Note that this is 100% of the collateral required, so that one could not put his entire account into these positions. Rather he should use some risk management, such as limiting the exposure, per position, to 3% to 5% of one’s speculative funds
That maximum loss occurs below the lowest strike in the spread (175 in this case). Moving to the right, the black line rises up to the higher strike in the put spread (185). The overall position is still a loss at this point, but now only $310, the debit of the position. From 185 to 190, at expiration, the position would lose $310. Above 190, the long call begins to dominate and profits begin to accrue above 193.10, the upside breakeven point.
Also in Figure 3, note the shape of the colored lines, which depict the profits and losses prior to expiration. They almost look exactly like those of a routine call purchase – stretching from the maximum loss area on the left of the graph and rising to meet the expiration line asymptotically far above the highest strike price.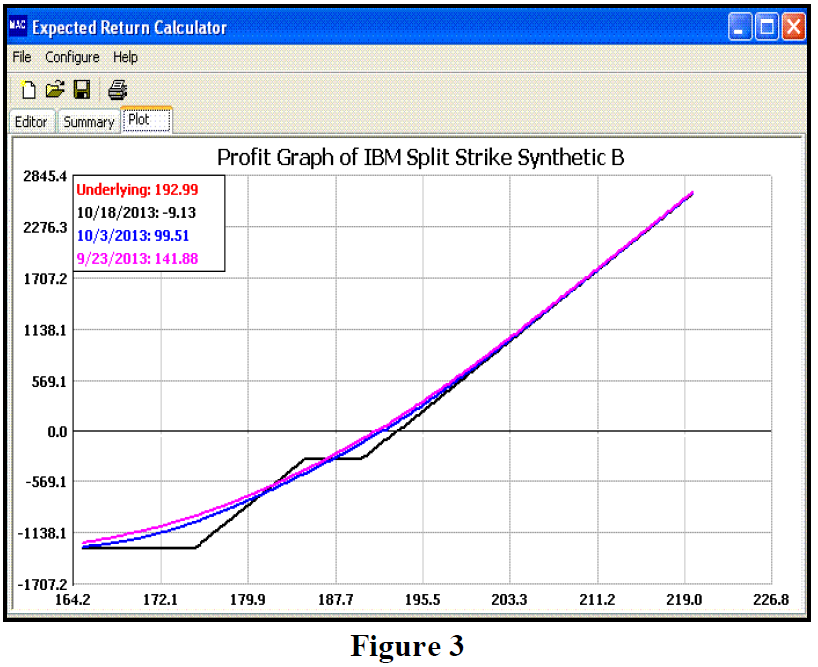
One other consideration when comparing the previous examples to the example in Figure 3 is the use of stops. When one has a position with naked puts, he is obligated to use a stop because he cannot afford to let his losses get out of control. But in Figure 3, the loss is limited, so it is possible to hold this position with a stop loss (although as a routine matter, it is probably better to use mental closing stops than no stops at all).
If one were to hold the Figure 3 position without a stop loss, and if the stock fell below the higher put strike (185 in this case), there is a chance that the put could be assigned. That would be a nuisance, not a catastrophe, but if it happened, once would likely need to unwind the position post haste, because of the increase in the margin requirement if the stock were put.
Finally, the credit spread position is preferable if the underlying should suddenly gap in the adverse direction. If there is a naked option in the position, such a gap could be disastrous, but in the Figure 3 position, the loss is limited.
Summary
The use of these synthetic or modified synthetic strategies allows one to lessen the effect of time decay on what would otherwise be a simple long option speculative position. The sale of a credit spread against the long option is often a viable alternative: sell a put credit spread against a long call; or sell a call credit spread against a long put.
This article was originally published in The Option Strategist Newsletter Volume 22, No. 17 on September 16, 2013.

© 2023 The Option Strategist | McMillan Analysis Corporation