
By Lawrence G. McMillan
This article was originally published in The Option Strategist Newsletter Volume 11, No. 6 on March 29, 2002.
As this stock market continues to trade in a wide range, it is becoming more and more frustrating to all manner of participants – whether they be traders, investors, or option speculators. While I don’t claim to have done a thorough survey of a broad array of traders, I can tell you that the frustration is evident among those that I have spoken with. They include day traders, short-term traders, mutual fund managers, and investment advisors (newsletter writers). About the only ones who seem to be happy (but they are nervous) are naked option writers. They have been making money – as long as the striking prices of the written options are outside of the trading range – but they recognize (at least the smart ones do) that with volatility this low, a price explosion is possible at any time (hence, their nervousness).
The calendar spread is actually a reasonably good strategy for a market that has the potential to explode. The typical calendar spread involves buying a longer-term option and selling a near-term option, both with the same striking price. The calendar spread can be used in two ways: as a typical calendar when volatility is low or as a reverse calendar (selling longer-term options and buying short-term ones) when volatility is high. Clearly, we are in the former category now.
The regular calendar spread expands when volatility increases. In technical terms, the spread is said to have a positive vega. All this really means is that when implied volatility increases, all options increase in value – but longer-term options increase more than shorter-term ones do. Hence the spread would widen if implied volatility increased.
Moreover, a calendar spread – which can be constructed with either puts or calls – reaches it maximum width when the stock is exactly at the striking price used in the spread, at expiration of the near-term options. In a more general sense, for any point in time (prior to expiration) the spread will be at its widest when the underlying is just slightly above the striking price. The profit graph below depicts these facts for this spread:
    Buy XYZ August 50 call for 8
    and Sell XYZ May 50 call for 5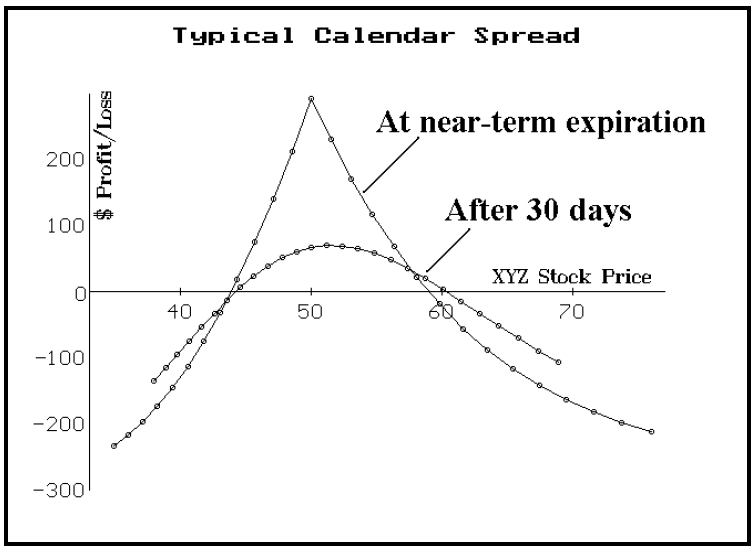
The above graph shows a call calendar spread. A Put calendar spread would have a similar profit graph, except for the fact that the maximum height of the put profit graph would be lower.
So, clearly, a calendar spreader wants to position the striking price of the spread so that the underlying has a decent chance to trade near the striking price at some time during the last few weeks of life of the near-term options. A neutral approach is to establish the calendar spread with a striking price approximately equal to the current stock price. However, many traders prefer to initially position themselves so that the stock must move to the striking price. For example, they might start with both calls being out-of-the-money. This normally means that the initial cost of the calendar would be smaller than an at-the-money calendar would be. Hence, if the stock does move up to the striking price in that case, his return would be larger. Conversely, with put spreads, a trader with a similar mentality would use out-of-the-money puts, looking for the stock to move down to the striking price.
When the market is in a trading range, a feasible strategy would be to buy both an out-of-the-money call calendar spread and an out-of-the-money put calendar spread. We have used this strategy a couple of times in the past. In fact, we currently have such a strategy in place, using $OEX options.
If one merely buys an equal number of call and put spreads, with the underlying price somewhere about halfway between the two, his calendar spread profit potential will resemble that shown in the following figure:
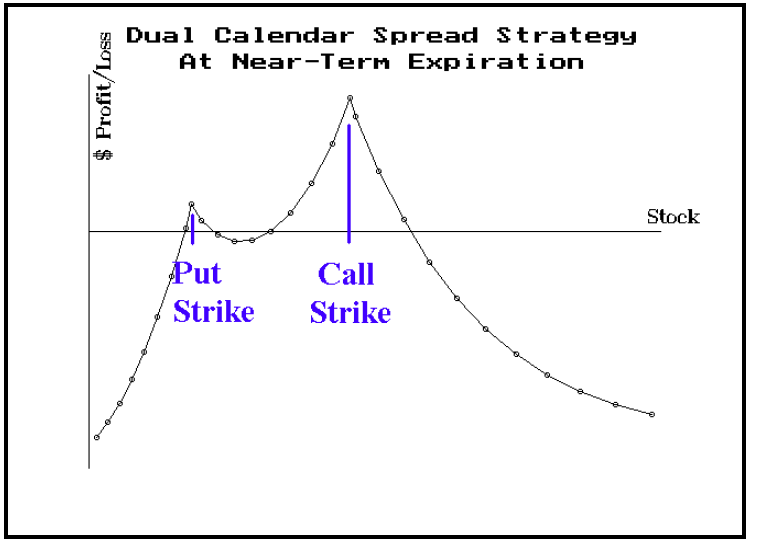
Actually, the profit graph only looks like this for stock and index options – mostly stocks. The way to “counter” the paltry profit potential at the put strike is to buy additional put spreads – an action which will subtract somewhat from the maximum profit at the calls’ strike, but will boost the profit potential of the puts’ strike. The total risk of the position is the sum of all the debits paid for the total of the put and the call spreads.
An increase in implied volatility will lift the profit curve. Thus it is important to establish calendar spreads when the options are relatively cheap. In a true trading range scenario, one would remove the call spread when the underlying traded up to the striking price of the call spread; then he would remove the put spread when the underlying traded down to the lower end of the trading range – towards the striking price of the put spread. This strategy would fail if the underlying broke out of the trading range, but at least one side of the spread would have been removed for a profit in that case.
Moreover, there is the possibility that the underlying does not trade at either striking price, but rather remains in the middle of the strikes until expiration. In that case, both the short-term call and put would expire worthless, and the spreader would thus own the out-of-themoney strangle. This is usually not the optimal scenario, but it still allows one to profit if the underlying can subsequently make a move through either strike or if implied volatility increases.
The selection criteria for these spreads are best defined as 1) choose a stock (or an index, or a futures contract) that is in a trading range and 2) ensure that the position has a positive expected return – either via a return to “normal” volatility or a movement by the under-lying that can produce profitability. Either of these criteria would have to be evaluated using statistical projections of volatility increases or stock price movement.
In assessing the current universe of cheap options, in which the underlying is trading relatively midway between support and resistance, and where options are liquid, these four candidates for the dual calendar spread strategy present themselves:
Stock              Strikes     Months
Goldman Sachs (GS) 80/95      May/July
Q-Logic (QLGC)     40/55      May/July
Semi HOLDR (SMH)   40/50      May/Aug
Veritas (VRTS)     35/50      May/Aug
Open interest is fairly high in each of these, and they are all trading in a very low percentile of implied volatility. While it is very difficult to choose between them, we are going to recommend a dual calendar in Veritas (VRTS). Subscribers with excess funds may want to consider one or more of the others as well. In this position, we will remove either spread if VRTS trades at the striking price. Position E339: Dual Calendar in Veritas Buy 3 Aug 50 calls (VIVHJ) and Sell 3 May 50 calls (VIVEJ) and Buy 5 Aug 35 puts (VIVTG) and Sell 5 May 35 puts (VIVQG) For a total debit of 17.50 or less VRTS: 42.37 Aug 50 call: 3.60 Aug 35 put: 3.20 May 50 call: 1.10 May 35 put: 1.20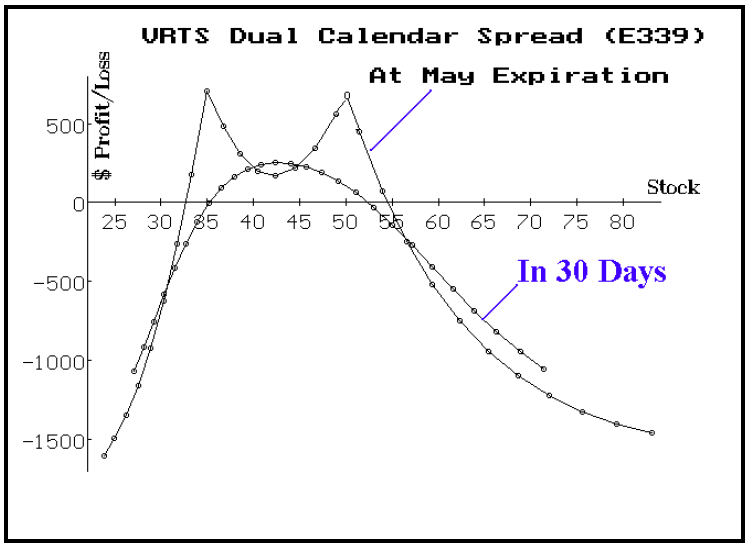
This article was originally published in The Option Strategist Newsletter Volume 11, No. 6 on March 29, 2002.

© 2023 The Option Strategist | McMillan Analysis Corporation