
By Lawrence G. McMillan
This article was originally published in The Option Strategist Newsletter Volume 3, No. 14 on July 28, 1994.
We often write about volatility since it is the variable which most directly determines the price of an option. Oh, sure, the other variables are important — stock price, strike price, and time to expiration — but those are determinant things since we always know their value at any given time. However, volatility is the big question mark, the one variable that dances to its own beat, that can make or break a strategy even if the stock or futures price behaves as one expected.
Right now, implied volatility is low and index options are "cheap" as a result. But that's the way it's supposed to be, isn't it, with the summer doldrums upon us and all? Well, not so fast — it just so happens that the August-September time period is a pretty volatile one if one wants to rely on data from the past 13 years.
Time       General Dow   Movement   Percent
               Level
Aug 1993:      3500        +80       +2.3%
Sept 1993:     3500       -120       -3.4
Aug 1992:      3300       +140       +4.2
Sept 1992:     3300       -240       -7.3
Aug-Sept 1991: 3000        -90       -3.0
July-Oct 1990: 3000       -640      -21.3
Aug-Sept 1989: 2700       +130       +4.8
Aug-Sept 1988: 2100       +120       +5.7
Aug-Sept 1987: 2700       -220       +8.1
Aug 1986:      1800       +160       +8.9
Sept 1986:     1800       -160       -8.9
Aug-Sept 1985: 1600        -60       -3.8
Aug 1984:      1100       +150      +13.6
Aug-Oct 1983:  1200       +125      +10.4
Aug 1982:       800       +160      +20.0
Aug 1981:       950       -130      -13.7
In fact, one of the sharpest market rises of all time occurred in August, 1982, while the August-September period of 1990 was one of the sharpest declines. Even in years without recordsetting volatility, the August-September time period has often seen moves of 8% or more, which would translate to about 300 Dow points at today's levels. We think this is a good opportunity for option buying strategies, as option prices are low and we think there is a good probability of another volatile market move in the August-September period of 1994.
The table below summarizes recent Aug-Sept moves:
    Strict average: 170 points
    Average of single digit percentage moves: 138 points
While recent years have not had the percentage moves of the early 80's, the magnitude (i.e., actual price change) of the August-September moves have still been quite large. Not counting 1990, which was extremely volatile after Iraq invaded Kuwait, the average of the last 9 years has been 138 Dow points worth of movement in this August-September time frame.
Moreover, in each of the last two years, you have really had two moves — one up and one down — which enhances the probability of implied volatility increasing in the options. When option traders see volatile market action, especially to the downside, then they bid for options more aggressively, since they want to own them. This aggressive bidding increases option prices and, hence, increases implied volatility as well.
As far as direction is concerned, there are 8 positive moves in the above table and 8 negative moves. So there is no clear-cut directional trend that asserts itself at this time of year. This entire situation presents us with the background for establishing a potentially excellent strategy. If we own options in a "neutral" manner, we can make money if prices rise or fall far enough. The data from the above table indicates that there is a good chance that prices will be volatile in the next two months, if history is any guide.
Moreover, since we would be buying options at a relatively "cheap" value (at least as measured by the current low levels of implied volatility), we stand to benefit if implied volatility increases also. In other words, we could profit if option traders perceive prices are going to be volatile, even if the market itself has not made much of a move.
In order to take advantage of these various scenarios, we are recommending the following "neutral" position; it is the same position we recommended on last Friday's HOTLINE:
  Position I54: Buy 6 OEX Nov 420 calls
       and sell 4 OEX Sept 410 calls
       and buy 2 OEX Nov 410 puts
  For a total debit of 43 points or better
       Risk Rating: Below Average Risk
$OEX: 421.87          Nov 420 call: 12¾
Sept 410 call: 15½    Nov 410 put: 7d
Profitability: This position is quite similar to the one we established near the end of May. It was quickly profitable when the market took a tumble in June, not only accelerating to the downside, but causing implied volatilities (i.e., the prices of the options we owned) to increase also. View the spread as two components: 1) a call backspread in which we own 6 at-themoney calls and hedge their purchase by selling 4 in-themoney calls; this portion will make money to the upside since we own 2 extra calls, and 2) put purchases to provide some downside profit potential.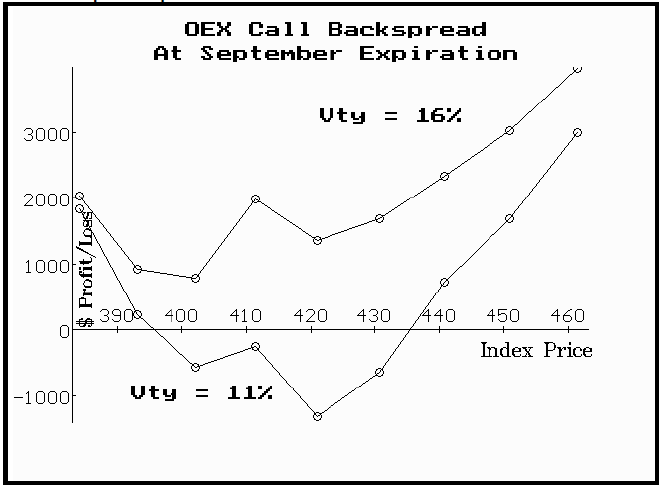
As initially constructed this position is extremely neutral to market movement. It won't profit or lose much as OEX fluctuates near the 420 level. This is called "price neutral", or "delta neutral". In addition, it does not have much exposure to time decay, at least in the beginning: it is expected that the entire position will lose about $20 a day due to time decay. What it does have is an extreme sensitivity to changes in volatility of the OEX options. If volatility increases from the current 11% level to 12%, for example, the position will make over $500. As time passes, or if OEX rises or drops dramatically in price, then this "neutrality" will be altered. Initially, however, this is a very attractive position if one a) expects increasing implied volatility or b) expects market movement.
The profit graph above depicts two scenarios at September expiration, if implied volatility remains unchanged near 11% (lower curve on graph) and if implied volatility increases to 16% (higher curve on graph). In the April decline, implied volatility increased briefly to over 22%, and was well above 16% for quite a while; in the June decline, it topped out at levels just over 17%. So there is a precedent that we could see implied volatilities increase to those levels. A chart of implied volatilities as represented by the CBOE's Volatility Index (symbol:$VIX) is included in the insert. Note that the chart in the insert shows that implied volatilities increased to 16% in September of 1993, having risen from the 11% level, where they reside today.
Referring once again to the profit graph on page 2, notice that there is a "bubble" of sorts near 410, where profits tend to increase. That is due to the fact that the September calls would be worthless at that price, but the November calls would still have reasonably good value.
Also notice that the position — as it is now constructed — has a somewhat bullish bias at September expiation. If this makes you uncomfortable, you might want to buy three November 410 puts instead of two. If you do decide to purchase the extra put, you will of course cut down on your upside profit potential, but the overall position will still profit handsomely if implied volatilities increase.
Investment: The position must be paid for in full. In addition, the four "bear" spreads (long Nov 420 call/short Sept 410 call) must be margined. One must have collateral in the account to the extent of $1000 per "bear" spread. Thus, overall the position requires the debit of $3021, including commissions, plus $4000, for a total of $7021.
Follow-Up Action:
Since we have limited risk, we won't set any mental stop-out prices. However, we expect to remove this position by September expiration. We would take profits if implied volatilities increase to 16% or if prices move substantially. Monitor the Volatility Index (symbol:$VIX); if VIX rises to 16%, call the HOTLINE to verify that the position should be removed. Also, if OEX trades up to 440 or trades down to 400, call the HOTLINE for possible adjustments to the position.
This article was originally published in The Option Strategist Newsletter Volume 3, No. 14 on July 28, 1994.

© 2023 The Option Strategist | McMillan Analysis Corporation