
By Lawrence G. McMillan
This article was originally published in The Option Strategist Newsletter Volume 16, No. 14 on July 27, 2007.
What Is A “90% Day?”
A “90% Day” must satisfy two criteria: 1) either advances or declines comprise more than 90% of all issues that moved that day (unchanged issues don’t count), and 2) either advancing or declining volume was 90% or more of the sum of advancing and declining volume.
As many of our readers know, we keep advance-decline data in two formats: 1) the traditional NYSE data, and 2) “stocks only” data – comprised of all optionable stocks trading at the time. The reason for doing this is that the NYSE has many issues trading that are not stocks. Many of these issues are interest rate related or are ETF’s. These can and do distort the data at certain times. One big problem has been that the introduction of decimalization (trading stocks in pennies) allowed many preferred stocks and other interest-rate related issues to become advancing or declining issues on days when they would have been unchanged in the past.
The Study
90% days are quite rare, as you shall see. The idea behind trading them is that so many traders have piled onto the bandwagon in one direction, that there likely isn’t much more behind that, and so the market will reverse direction – at least in the short term.
We have a considerable amount of data on hand, and rather than create new data bases, we used what we had. This means that the “stocks only” data went back to 1994, and the NYSE-based data went back through 1998. The study could certainly be extended even further back – especially where the NYSE data is concerned. However, that wouldn’t likely alter the results of the study – especially since decimalization didn’t really take hold until 2002, and we should therefore be concentrating on data that is post-decimalization.
Two separate studies were constructed – one for the “stocks only” data and one for the NYSE data. The data from Tuesday, July 24th, was not included, since we don’t really know the outcome yet from that “signal.” However, it will be discussed later.
The “stocks only” study was prepared first. The first signal occurred on February 2, 1994, and the most recent signal occurred on June 7, 2007 (that was a day on which the Dow was down 200). In all, there were 40 times in which 90% of the action was on the downside, and 17 times when 90% of the action was on the upside.
When the action is on the downside, it means that declines dominated advances by a ratio of more than 9-to- 1 and declining volume dominated advancing volume by a ratio of more than 9-to-1. When we say the action is on the “upside”, then advancing issues and advancing volume dominate their declining counterparts by a ratio of more than 9-to-1.
The fact that there were 40 “downside” occurrences versus only 17 “upside” occurrences shouldn’t be all that surprising, for all traders know that the market can get far more carried away on the downside in a single panic-stricken day than it can on the upside.
In constructing a study such as this, one has to do more than just identify where the 90% days occurred. In other words, how do you trade the signal? We assume that we want to take a position opposite to the direction of the 90% day (although the study would have to verify that), but should it be a day trade, or a short-term overnight trade, or a longer-term trade? To that end, we used the performance of the $SPX Index as the guideline and measured it 1, 2, 3, 5, and 10 trading days after the signal was given – a signal meaning we buy $SPX after a 90% down day and we sell $SPX (short) after a 90% up day.
The “Stocks Only” output is summarized in Table 1 below. As we said earlier there were forty 90% down days in the study: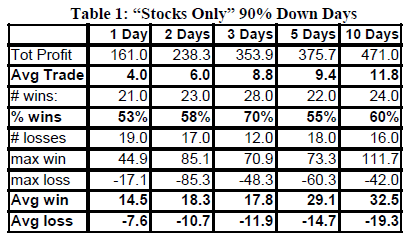
As you can see, buying the “market” (i.e., $SPX) at the close of a 90% down day is a profitable trade, whether you hold it for one day or ten. In each of the five different holding periods, there were more wins than losses and the average win was larger than the average loss. When you have both of those criteria in a trading system, it is a strong system. Most systems have one or the other, but not both.
An argument could be made that the three-day holding period is the best, as it has the highest percentage of wins (70%) and nearly as large an average profit (8.8 $SPX points) as the 5- or 10-day holding periods. In actual practice, one would probably take partial profits after three days and employ trailing stops after that.
In any case, there is one problem here – the size of the maximum loss in each case. Those are some very large $SPX point drops. Many of those maximum losses came in August, 1998, when there were 90% days two days apart. The second of those 90% trades was profitable, but the first was only a way station on the trip to the actual lows.
A similar situation occurred in March, 2004, during a fairly sharp market correction (which, frankly, is hard to recall without looking at a chart). There were three 90% down days in an eight day period. The first of those produced some large losses, but the other two produced sizeable gains.
So, by examining the data, we find that 1) a large loss is possible, and 2) one has to be able to take multiple trades if signals occur within close time proximity to each other. In our way of thinking, this indicates that all but the most aggressive traders would want to trade this system with call options, to limit the risk when those large losses are incurred.
So, our conclusion is that when a 90% down day occurs, buy SPY (or other S&P-based product) call options, planning to hold for three days at least. Take partial profits if they accrue, and use trailing stops. The chart on the right shows all 40 of the signals for the “stocks only” data on 90% down days. Note that the 40 signals are not evenly distributed over time. There was a hiatus from August of 1998 until April of 2000 (the day that Soros dumped his tech stocks and the Dow tanked over 600 points).
There was another long hiatus, with only one trade until near the bottom of the bear market in October, 2002. Note that there was no signal on the first day of trading after 9/11/01 (it was close, but was only an 88% down day).
Recently, there has been much more activity. This not only has to do with the hair-trigger way that hedge funds approach trading these days, but also the spread of electronic trading that has taken place.
90% Up Days (“Stocks Only”)
What about 90% up days? Is the market a short after one of these takes place, or does the system only work on the downside. Table 2 shows the results, in a similar format for the 17 occurrences of 90% up days in the “stocks only” data since 1994.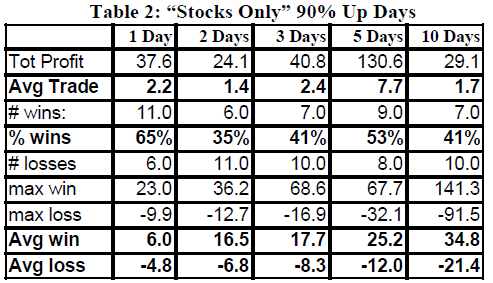
The data is a bit different than the 90% down day. The system is still profitable, but here the one-day holding period has the best percentage of wins. At first glance, it looks like the 5-day holding period might be best, but upon close examination of the data, there was one trade in July, 2002, that, by chance, produced a large profit for the 5-day holding period that none of the others experienced. We consider that to be an outlier.
It makes some sense – or at least it does to me – to think that the 90% up days should be approached as a very short-term trade. Most of the time, if the market backs off for a day after an extreme overbought condition, the buyers step in. Or at least they have for the last four years. Hence, approaching the 90% up day signal as a potentially very short-term trade seems to be logical.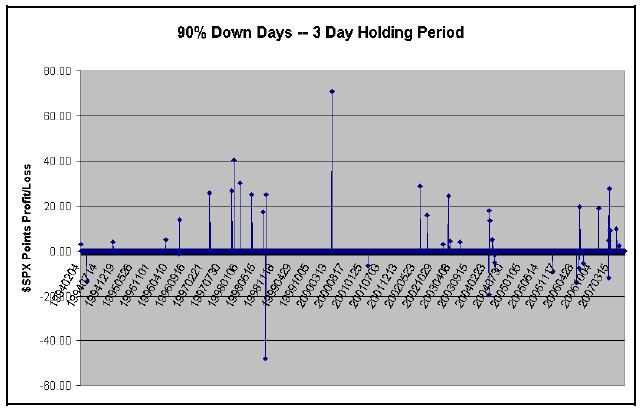
To summarize, on 90% Up days, buy SPY (or other $SPX-related product) puts, expecting to exit at the close of the next day. If a large profit accrues, then perhaps the “partial profit and use a trailing stop” approach could be instituted, but most of the time, there is little to be gained by hanging on for several more days.
NYSE-based Data
So, there were 57 signals (40 buys and 17 sells) from the “Stocks only” data over 13 years of trading – about 4 or 5 per year, on average. That’s not bad. It’s certainly not an active system, but it occurs often enough that one should pay attention to it.
What about the NYSE-based data? Recall, we only took this back to 1998. In that time there were...no (ZERO!) 90% up days. Moreover, there were only three 90% down days. The fourth and fifth 90% down days have now been added this week, but not as part of the study.
One signal occurred just over a month ago, on June 7th, 2007, and it was profitable across all the holding periods, as the market bounced back quickly after that one day’s selling. The only other occurrences were on backto- back days in May, 2004. Buying the market at the end of the first day (5/7/2004) was not profitable, but buying at the end of the second day was.
While I’m not sure we should be drawing conclusions about a trading system based on only 3 trades (2 of which were profitable), the 10-day holding period was best here.
Summary
This appears to be a tradeable system, and we will add it to the arsenal of trades we follow in our newsletters, although it will obviously be most timely in Daily Volume Alerts and The Daily Strategist.
This article was originally published in The Option Strategist Newsletter Volume 16, No. 14 on July 27, 2007.

© 2023 The Option Strategist | McMillan Analysis Corporation