By Lawrence G. McMillan
This article was originally published in The Option Strategist Newsletter Volume 9, No. 12 on June 22, 2000.
The reverse calendar spread strategy is not one that is employed too often, probably because the margin requirements for stock and index option traders are rather onerous. However, it does have a place in an option trader’s arsenal, and can be an especially useful strategy with regard to futures options. The strategy has been discussed before in The Option Strategist, and it is apropos again because it can be applied to the expensive options in the oil and natural gas sectors currently.
First, some definitions. In general, when a strategy has the term “reverse” in its name, the strategy is the exact opposite of a more commonly used strategy. Thus, the reverse calendar spread is – as its name implies – a position that is just the opposite of a “normal” calendar spread. In the reverse calendar spread, one sells a long-term call option and simultaneously buys a shorter-term call option. The spread can be constructed with either puts or calls. As in the “normal” calendar spread, both options have the same strike.
This strategy will make money if one of two things happen: either 1) the stock price moves away from the striking price by a great deal, or 2) the implied volatility of the options involved in the spread shrinks. For those readers familiar with the “normal” calendar spread strategy, the first way to profit should be obvious – for a “normal” calendar spread makes its most money if the stock is right at the strike price at expiration, and it loses money if the stock rises or falls too far. It is usually less obvious to “normal” calendar spread traders that they make money if volatility increases, but it is a true fact nonetheless.
As with any spread involving options expiring in different months, it is common practice to look at the profitability of the position at or before the near-term expiration. It makes no sense to continue to remain short the long-term option after the short-term one expires. An example will show how this strategy can profit.
Example: suppose that the current month is June, that XYZ’s options are quite expensive, and that one feels the underlying stock will be volatile. Then a reverse calendar spread would be a way to profit from these assumptions. The following prices exist:
XYZ stock: 80 XYZ December 80 call: 12 XYZ September 80 call: 8
A reverse calendar spread is established by selling the December 80 call for 12 points, and buying the July 80 call for 8 – a net credit of four points for the spread. These prices correspond to an implied volatility of about 50%.
If, later, XYZ falls dramatically, both call options will be nearly worthless and the spread could be bought back for a price well below 5. For example, if XYZ were to fall to 50 in a month or so, the Sept 80 call would be nearly worthless and the December 80 call could be bought back for about 3/4 of a point. Thus the spread would have shrunk from its initial price of 4 to a price of less than 1 – a profit of over 3 points.
The other way to make money would be for implied volatility to decrease. Suppose that implied volatility dropped to 40% after a month had passed. Then the spread might be worth something like 3.25 points – an unrealized profit of about 0.75 points, since it was sold for a price of 4 initially.
So there are two ways to make money with this strategy, and it is therefore best to establish it when implied volatility is in a high percentile and the underlying has a tendency to be volatile.
The problem with this spread, for stock and index option traders, is that the call that is sold is considered to be naked. This is preposterous, of course, since the shortterm call is a perfectly valid hedge until it expires. Yet the margin requirements remain onerous. When they were overhauled recently, this glaring inefficiency was allowed to stand because none of the member firms cared about changing it. Still, if one has excess collateral – perhaps from a large stock portfolio – and is interested in generating excess income in a hedged manner, then the strategy might be applicable for him as well.
The Reverse Calendar Using Futures Options
For futures options, however, the margin regulators have their heads screwed on straight so that the requirement is merely the premium of the position as long as the spread is maintained. This makes the strategy more viable for the smaller investor as well as from a “rate of return” point of view.
However, with futures options, the strategy may become more complicated. The reason is that if one is considering spreading a December option versus, say, a September option, they might represent two different futures contracts (such as September S&P’s and December S&P’s). In such a case, one is not only spreading the two options, but must be concerned with the actual movement of the spread between the two futures contracts as well. This would not be a consideration for serial futures options – that is, futures options that have the same underlying contract (August S&P options and September S&P options, for example). But, where the two underlying futures both exist in their own right, one must be mindful of how the spread between the two futures might behave when evaluating a calendar spread, whether it be “normal” or “reverse”. We’ll examine how this works while analyzing a potential new position.
At the current time, the most expensive futures options are in the contracts of Crude Oil, Heating Oil, Unleaded Gas, and Natural Gas. All four are relatively volatile, and the near-term, September options in each have implied volatilities in the following percentiles, respectively: 95th, 94th, 95th, and 97th. Not only that, but these are volatile futures contracts in their own right, judging by the fact that their 20-day historical volatilities are 33%, 35%, 29%, and 65%, respectively.
As an example of the analysis of a calendar spread, let’s use the Natural Gas futures since they are the most expensive and also reside in the highest percentile of implied volatility. This is not to necessarily say that those two facts automatically make them the best candidates of these four contracts. It might be quite possible that liquidity in Crude Oil options is better and that might be an over-riding factor. But for the purposes of an analytical example, the Nat Gas futures should prove to be useful.
In all of the four contracts shown above, there is an actual futures contract that expires each and every month. Thus, there are no serial options. This also means that our analysis will eventually have to consider the possible spread movements between the individual futures contracts. Let’s defer that part of the analysis until later, though, and first consider the options themselves.
The pertinent details of at-the-money options that one might consider in a reverse calendar spread in Nat Gas futures options are:
| Futures Contract | Sept Nat Gas | Oct Nat Gas | Nov Nat Gas | Dec Nat Gas | March '01 Nat Gas |
| Futures Price | 41.03 | 40.97 | 41.86 | 42.85 | 38.10 |
| At the Money Option | Sept 41 call | Oct 41 call | Nov 42 call | Dec 43 call | Mar '01 38 call |
| Option Price | 4.48 | 5.23 | 6.00 | 6.70 | 6.07 |
| Option Implied Vty | 62.2% | 61.6% | 60.6% | 59.8% | 48.1% |
| Option Ex. Date | 8/30/2000 | 9/28/2000 | 10/30/2000 | 11/29/2000 | 2/27/2001 |
One important thing stands out immediately: the implied volatilities of the options diminishes as one looks farther out in time. This is fairly common behavior for expensive options. We have often remarked upon the fact that LEAPS options have lower implied volatilities than their near-term counterparts when options are expensive. The same sort of effect applies here.
What this means for the spreader, though, is that one would not want to have too great of a difference in the expiration dates of the these futures, lest he be selling an option that is far less expensive than the one he is buying. For example, if one were to establish the calendar spread by buying the Sept 41 call (implied volatility 62.2%) and selling the March ‘01 38 call (implied volatility 48.1%), he would be at a fairly great theoretical disadvantage since the one he is buying has a much larger implied volatility than the one he is selling. Thus, it seems much more reasonable to use the options expiring in the months September through December.
Position F224: Reverse Calendar Spread
Buy 1 Sept 41 call @ 4.48
Sell 1 Dec 43 call @ 6.70
For a credit of 2.20 points
A 1.00-point move in Nat Gas futures is worth $1000.

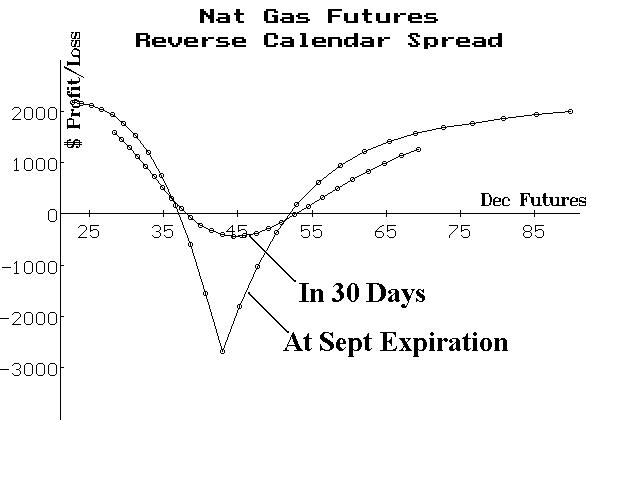
The preceding graph depicts the profitability at September expiration of this position, under the additional assumption that the spread between the Sept and Dec futures remains at its current level (1.82). This graph also assumes that the implied volatilities of the options remains unchanged. It is quite clear that, if Dec Nat Gas futures move below 37 or above 53 (and the spread between Sept and Dec futures remains relatively constant), the spread will make money. Profits are limited, though, to the initial credit of the spread ($2200).
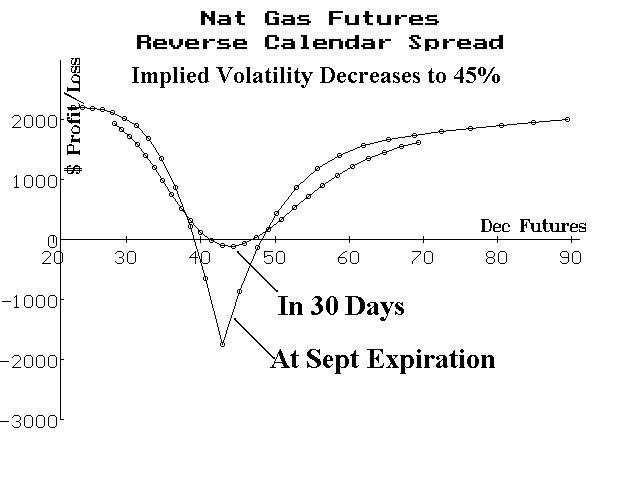
As for the effect of implied volatility (IV), look at the graph below. It shows how profitability would improve if IV dropped by September expiration.

The other factor to consider is what might happen to the spread between Sept and Dec Nat Gas futures themselves (not the options). This position would be harmed if Dec futures outperformed Sept futures, and would be helped if the opposite occurred. The spread between the two has typically been about 2.00 to 2.50, so right now it is a little on the low side (1.82). That is a slight negative for the example reverse calendar position. It seems that, as Nat Gas prices have risen, the spread between the two futures has tended to decrease. So, in one sense one might say that establishing the spread at these levels imparts a slightly bullish outlook for Nat Gas futures. To counter that, one might add something slightly bearish if he establishes a large reverse calendar – perhaps some long puts, for example. Another alternative would be to establish the spread with puts initially, which would then have exposure if the Sept-Dec spread widened as Nat Gas futures fell.
This article was originally published in The Option Strategist Newsletter Volume 9, No. 12 on June 22, 2000.
© 2023 The Option Strategist | McMillan Analysis Corporation

