
By Lawrence G. McMillan
This article was originally published in The Option Strategist Newsletter Volume 12, No. 12 on June 25, 2003.
In literally every issue of this publication, we discuss the levels of implied volatilities of various groups of options – stock options, index options, or futures options, for example. Of particular interest, in general, is how stock options are behaving, for they are the backbone of our volatility trading strategies. For example, if stock options are generally cheap, then we want to buy volatility. If they’re expensive, then we look for other strategies that take advantage of their expensiveness. Over all the years, we have not created a measurable index to treat the general level of stock option implied volatility, and that is an oversight that we intend to correct with this issue.
The way we typically rank the options of each stock, index, or future, is to compare today’s composite implied volatility with those of the previous 600 trading days. We assign today’s reading a percentile ranking over the last 600 days. If the current implied volatility is in the 10th percentile or lower, we say the options are cheap, while if the current implied is in the 90th percentile or higher, the options are expensive.
For example, we often make statements such as “over 1000 stocks have implied volatilities that are currently in the 10th percentile or below.” On the surface, we understand that such a statement means that there are a lot of cheap options. But we don’t have a specific “handle” on exactly what this means. How many stocks don’t have cheap options if those 1000 do have cheap options? What is the distribution over the entire spectrum? That is, are the remaining “non-cheap” options spread equally over the rest of the percentiles, or are they very nearly cheap themselves? Furthermore, where does the “average” stock option lie, in terms of percentiles?
These and many other questions have occurred to me over the years, but I never thought about quantifying them. Then, an idea finally hit home last week as I was viewing the sector distribution chart published weekly by Dorsey, Wright and Associates (800-247–5234). They rank the various sectors according to the number of stocks in each sector that are on buy signals. Then they publish a histogram of how the sectors rank. It is a very quick way of seeing whether stocks are overbought, oversold, or something in between (currently, the picture is that of an overbought market, but that shouldn’t surprise anyone). With credit to Tom and his graphics, I tried to envision something similar for stock option implied volatilities. What I came up with is shown in the graph in Figure 1, above. It depicts the current level of stock option implied volatilities.
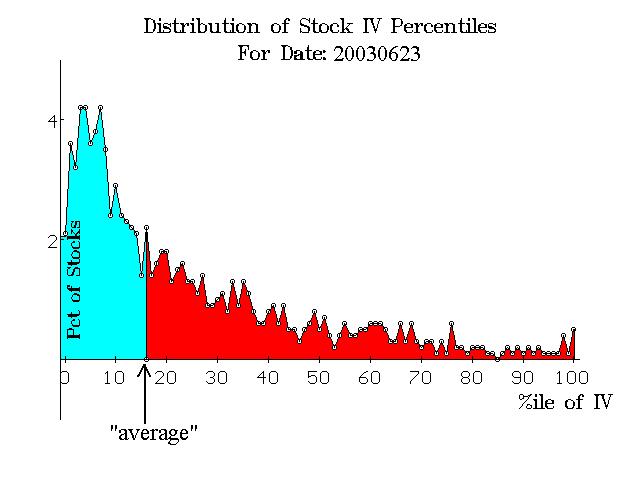
The scales on the graph are important. The X-axis shows the percentile of implied volatility. Hence the X-axis runs from 0 to 100. The Y-axis depicts what percent of all stocks lies in the given percentile. For example, consider the far lefthand side of the graph, the 0th percentile. About 2.1% of all stocks have options so cheap that their current level of composite implied volatility is in the 0th percentile.
Several things can be easily gleaned from the graph. First of all, the coloration separates the graph into two halves. Half of the stocks are in the blue shaded area, and half are in the red. Hence, the “average” stock has options that are in about the 16th percentile of implied volatility (an arrow is drawn on the chart to depict this point). Only about 2.2% of all stocks actually have options in the 16th percentile exactly, but that is relatively unimportant. From this graph, it is easy to see that stock options, in general, are “cheap.” That is because the “average” is low and the preponderance of readings (the tallest part of the graph) is way on the left side. Over 4% of all stocks have implied volatility in the 4th, 5th or 8th percentile (the highest points on the graph – over on the left side).
Conversely, there are very few expensive options. You can see that the red area is very small above the 90th percentile – the area in which we’d say options are expensive. It is interesting, to note, though, that some stocks have expensive options even when so many have cheap options. This is the beauty of volatility trading, actually, because there are almost always some cheap options and some expensive options. In this case, I’d guess that the expensive options are mostly related to special situations, such as upcoming FDA hearings and the like.
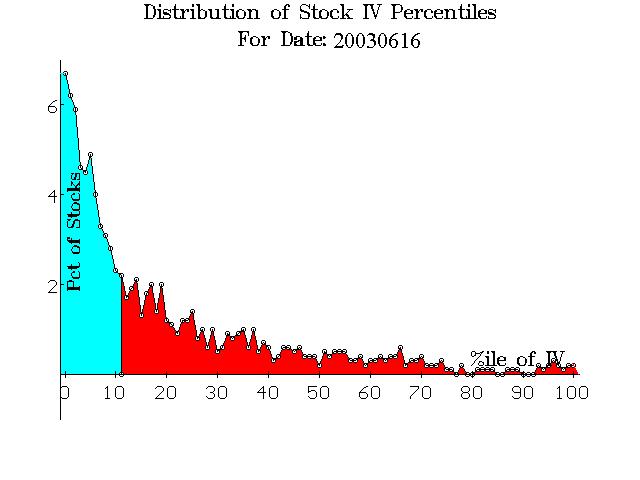
What is also interesting is the comparison of these graphs over time. That is, as time goes by we will be able to compare or contrast the current situation with other similar situations in the past. For example, as cheap as the options look in Figure 1, they are not as cheap as they were a week ago – on June 16th, the day the market made its high (so far) for the current rally. Figure 2 depicts how things looked just a week ago. At that time, about 6.5% of all stocks had composite implied volatilities in the 0th percentile, and the “average” stock’s percentile reading was the 11th percentile. You can see that Figure 2 depicts a spectrum that is definitely more “squashed” to left than that of Figure 1. However, both cases depict a stock option spectrum that is loaded with cheap options – indicating that option buying should be favored and selling should be avoided, in general.
The opposite extreme would occur when implied volatility is high. One of the highest recent volatility readings was last July, 2002 – specifically, July 24th, the day of the peak in $VIX at that time. The stock option implied volatility spectrum graph for that date is pictured on the right. Note that it is virtually the opposite of what we are seeing now. Thus, the spectrum also easily identifies situations where stock options are rather uniformly expensive.
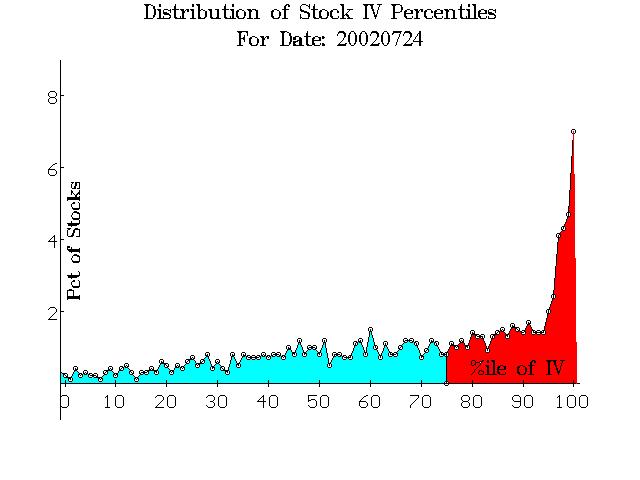
Last July, the “average” stock’s options were in the 75th percentile of implied volatility – the point where the blue and red sections of the graph are separated. Not only that, but about 7% of all stocks saw their implied volatilities in the 100th percentile – the most expensive they had been in the last 600 trading days. It is also worth noting that even in that time of extremely expensive options, there were a few stocks whose options were in the 10th percentile or lower.
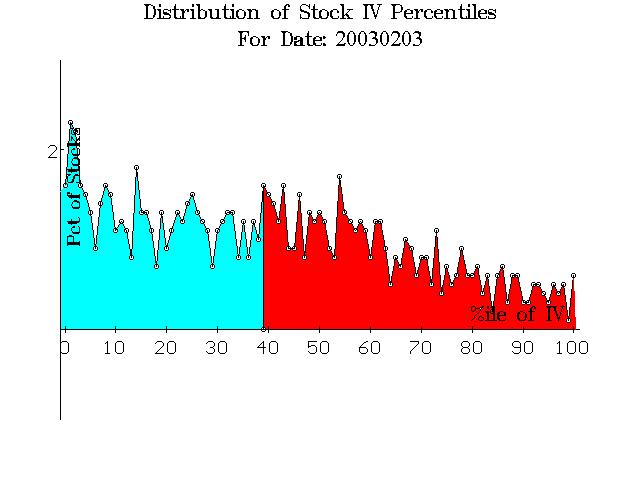
One other question that arises is “What does ‘normal’ volatility look like?” That question can be answered, but one has to define a period of time when volatility was ‘normal,’ so a spectrum graph can be created. If one looks at a graph of $VIX over the last year (insert), there appear to be two “flat” areas more or less in the middle of the $VIX chart where it might be considered ‘normal’ – one in December, 2002, and one in February-March, 2003. The implied volatility spectrum graph from February 3rd is printed on the right, in Figure 4. It is relatively flat from left to right. Note that the highest point on the graph is only about 2% – not very high considering the previous graphs. Also, the “average” stock’s options were in the 40th percentile.
This graph is somewhat surprising – or at least it was to me. I had thought that, in a “normal” volatility environment, there would be a big grouping in the middle of the chart – near the 50th percentile – rather than the flat distribution shown in Figure 4. You might think that 2/3/03 was perhaps a poor choice of date. However, we tested several other dates during times of “flat” $VIX and the graphs all looked more or less like the one shown in Figure 4. So, one must conclude that, during a period of relatively stable volatility, individual stock option implied volatility percentiles are spread rather uniformly across the entire spectrum – from the 0th percentile to the 100th.
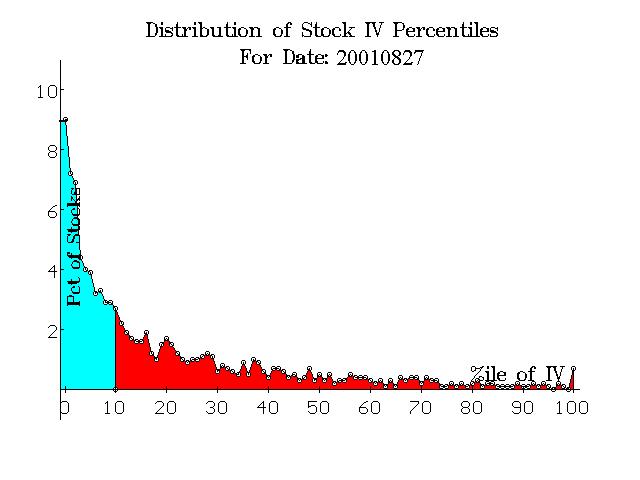
We have created software that can read our databases of implied volatility and create these graphs for any date that is in the database. To test it, I ran the spectrum graph for the date I remember as being an extreme low in stock volatility – right before the chaos caused by the terrorist attacks on 9/11/01. The date of the spectrum graph in Figure 5 is 8/27/01. On that date, fully half of stocks had cheap options and 9% were in the 0th percentile – a truly opportune time to buy straddles.
In summary, this implied volatility spectrum graph will be a good addition to our newsletter, and it will take up permanent residence on the implied volatility page – normally page 7 – beginning next issue.
This article was originally published in The Option Strategist Newsletter Volume 12, No. 12 on June 25, 2003.

© 2023 The Option Strategist | McMillan Analysis Corporation