
By Lawrence G. McMillan
This article was originally published in The Option Strategist Newsletter Volume 8, No. 16 on August 26, 1999.
In this article, we’re going to look at a market tendency that has a long, reliable track record: a tradeable top usually appears in September – often near Labor Day – culminating in a good trading bottom sometime in October. This is a subject that we have addressed before, but not for the past three years. Fairly often, these turning points have been accompanied by market buy or sell signals from our oscillator and/or the equity-only put-call ratio.
This year, a buy signal has just been registered by the oscillator (see page 5 for further details). But that just might fit right in with the broad seasonal tendency. The market could rally into Labor Day or slightly beyond, then register a sell signal, and therefore fit right into the “normal” pattern. This is not one of those patterns that I would recommend trading without confirmation. In other words, just don’t go out and short the market on Labor Day, figuring that you’ll be able to cover at a nice profit by early October. Rather, it is more useful as a guide: be alert for sell signals in September, and when one occurs, be ready to jump on it. Then, if it works and the market is getting hammered in October, be alert for buy signals at that time.
The table of data on the top of page 2 summarizes these market move-ments for more than the past quarter century.
There are really only three scenarios that have occurred over this 26-year time period:
1) scenario 1: a top near Labor Day (16 times)
2) scenario 2: a top in late September (4 times)
3) scenario 3: a top is not made until October (6 times) In each case, there was a downward market swing that bottomed in October.
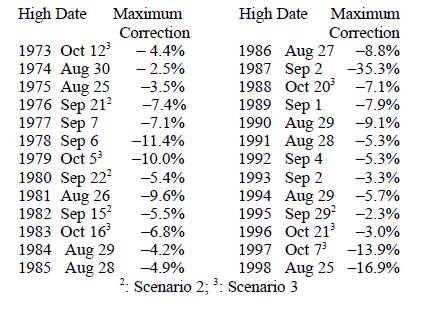
In a couple of those years – particularly 1990 and 1998 – the “high” noted in the above table was really only a reflex rally high. The actual high had occurred earlier – in July in both years. Unless $OEX actually rises back above its July, 1999, high at 735.86, a similar result may occur this year.
You may be wondering if you could have actually made money in all of these years. Probably not. If one figures that any sell signal lags an actual top by at least two percent, then any year in which the index failed to decline at least three percent would probably not have produced a profitable trade from the short side. Let’s call it four percent, just to be safe. Then, four of the 26 years would not have been profitable, but the others had drops of at least 4% – and many were quite a bit bigger than that. So, it seems as if it would behoove one to pay attention to the market, looking for a place to enter on the short side sometime over the next few weeks.
Having reached that decision, it then becomes imperative to set up some signals that can be relied upon in order to trade the signal. Short positions (or long put purchases) would be taken if any of the following occur: 1) an oscillator sell signal. Since we just entered into a buy signal, this may take some time to set up, but should it occur, it would be an excellent timing confirmation of the entry point. Recall that the oscillator would have to rise above +200 and then decline below +180 to generate a sell signal. 2) an equity-only put-call ratio sell signal. As you will see later in the letter, the equity-only put-call ratio has now rolled over to a buy signal, too. This happened rather quickly, but it now sets up this indicator for confirmation of the “Labor Day” sell signal. 3) the oscillator drops below -200. It could conceivably happen that the market flattens out and begins to decline, without ever having provided enough strength to get the oscillator up above +200. That is, the market could decline without an accompanying sell signal from the oscillator. However, even if that happened, the oscillator would have to drop to oversold territory below -200. If that happened, that would also be a signal that the “Labor Day” selloff was beginning. Note that eventually an equity-only putcall ratio sell signal would occur if the market started to sell off, but it is likely that the oscillator would fall below -200 before the slower-moving put-call ratio could roll over to a sell signal.
So, for now, remain long in accordance with the two buy signals that are in effect. However, remain on the alert for any of the above three conditions to be met. If they are, then it would be time to buy puts on $OEX. Alternative strategies would involve buying put spreads, although given the magnitude and swiftness of some of the moves in the past 26 years, I think I would prefer to just be outright long puts when the time arrives.
This article was originally published in The Option Strategist Newsletter Volume 8, No. 16 on August 26, 1999.

© 2023 The Option Strategist | McMillan Analysis Corporation